Template:Rms manual management monitoring submenu configuration: Difference between revisions
(Created page with " The '''Configuration''' function provides the possibility to configure custom time intervals at which router parameter values are updated in the RMS. ---- * First, choose a d...") |
No edit summary |
||
| (21 intermediate revisions by 2 users not shown) | |||
| Line 1: | Line 1: | ||
To change monitoring options for your device, go to the RMS web page, Left sidebar panel (<b>Management → Devices</b>), and click on the <b>Devices</b> submenu. | |||
Move your mouse pointer to the top control '''Monitoring''' menu and select '''Set update period''' (Monitoring → Set update period). | |||
<br> | |||
===Step by step instructions=== | |||
---- | ---- | ||
# First, choose a device(s) for which the configuration will apply. If you select multiple devices, it will not display current parameters. | |||
# Move your mouse pointer to the Monitoring top control menu and click "Set update period". | |||
[[File: | # After a new pop-up window should appear. Place checkmarks next to relevant parameters to set up custom monitoring intervals. You can set up the monitoring update frequency; on the right, you can set the time units for that setting. | ||
---- | # As you change these settings, the system will calculate an '''estimated monthly data usage''' value below in real-time. | ||
* | |||
At the top of your screen, you will get a notification in green text: '''<span style="color:#368d3b">Device updated</span>'''. | |||
[[File:RMS-top-control-menu-device-updated.jpg]] | |||
* '''Dynamic monitoring''' - updates these parameters: SIM State, PIN State, NET State, Signal, Operator, Operator Number, Connection State, Connection Type, RX Count(T/Y), TX Count(Y/Y), Firmware Version, SIM Slot, Router Uptime, Connection Uptime, Mobile IP, Cell ID, MCC, MNC, LAC, RX Day, RX Week ,RX Month, TX Day, TX Week, TX Month, ICCID, WAN State, WAN IP, Temperature. | |||
* '''Static monitoring''' - updates these parameters: IMEI, Model, Manufacturer, Revision, IMSI, Product Code, Batch Number, Hardware Revision. | |||
* '''Hotspot monitoring''' - updates these parameters: Hotspot ID, Hotspot SSID, Hotspot Enabled, IP, Download, Upload, Download Limit, Upload Limit, Hotspot Users, Hotspot Users Pass, Hotspot User Active, Hotspot User Macs, Hotspot User Ips, Hotspot User Start Times, Hotspot User Use Times, Hotspot User Downloads, Hotspot User Uploads. | |||
* '''I/O monitoring''' - updates these parameters: Digital Input, Digital Isolated Input, Analog Input, Digital OC Output, Digital Relay Output, Relay CFG, Output CFG. | |||
* '''GPS monitoring''' - GPS monitoring updates these parameters: Latitude, Longitude, FIX, Altitude, Speed, Satellites, Course, Status, Enabled, Accuracy. | |||
* '''Wireless monitoring''' - updates these parameters: Access point status, SSID, sent/received bytes per session, client count, connected device name, connected device MAC address, connected device IP address. | |||
=== Estimated monthly data usage === | |||
---- | ---- | ||
Estimated data usage calculates an estimate of monthly data usage based on the update period values specified above. | |||
<br> | |||
[[File:RMS Monitoring Data.gif]] | |||
Latest revision as of 19:21, 31 January 2021
To change monitoring options for your device, go to the RMS web page, Left sidebar panel (Management → Devices), and click on the Devices submenu.
Move your mouse pointer to the top control Monitoring menu and select Set update period (Monitoring → Set update period).
Step by step instructions
- First, choose a device(s) for which the configuration will apply. If you select multiple devices, it will not display current parameters.
- Move your mouse pointer to the Monitoring top control menu and click "Set update period".
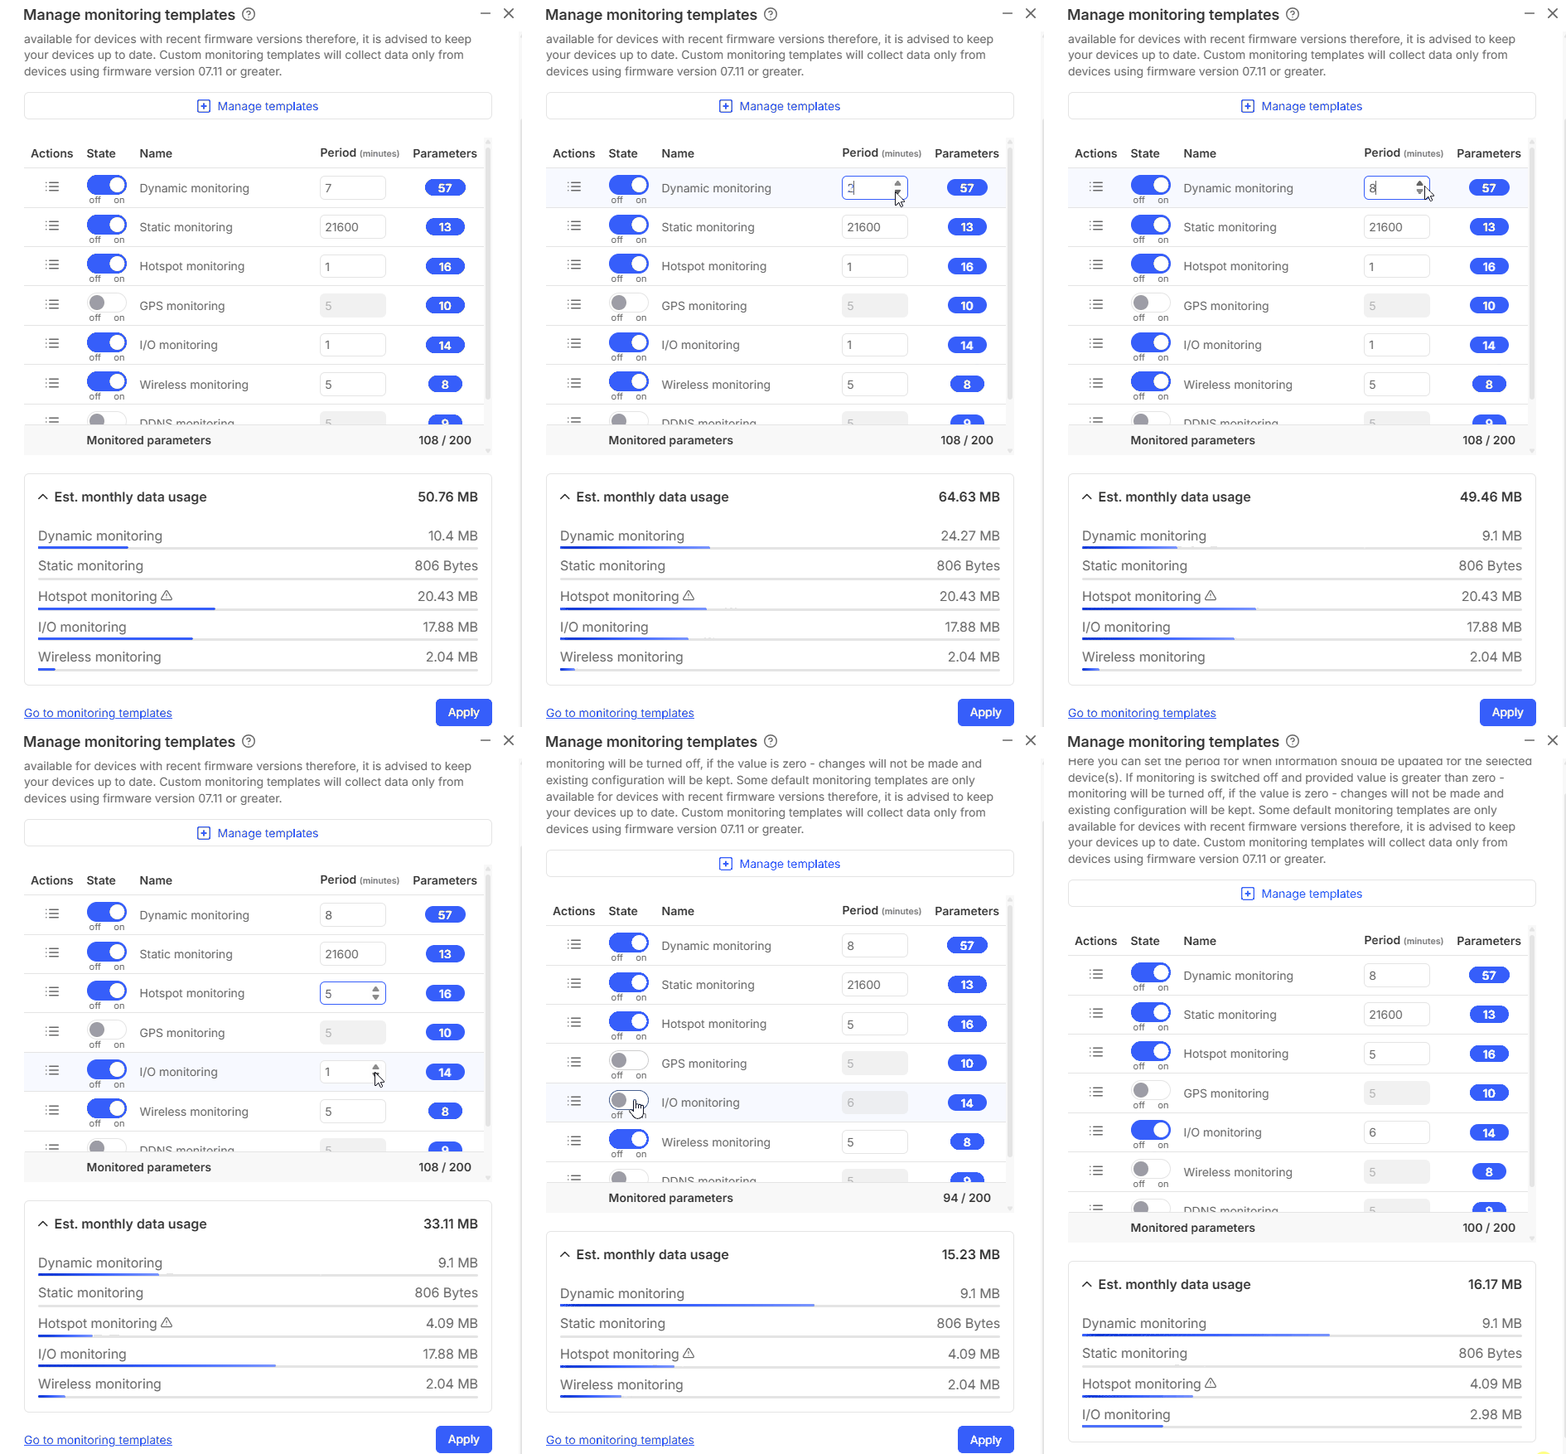
- After a new pop-up window should appear. Place checkmarks next to relevant parameters to set up custom monitoring intervals. You can set up the monitoring update frequency; on the right, you can set the time units for that setting.
- As you change these settings, the system will calculate an estimated monthly data usage value below in real-time.
At the top of your screen, you will get a notification in green text: Device updated.
- Dynamic monitoring - updates these parameters: SIM State, PIN State, NET State, Signal, Operator, Operator Number, Connection State, Connection Type, RX Count(T/Y), TX Count(Y/Y), Firmware Version, SIM Slot, Router Uptime, Connection Uptime, Mobile IP, Cell ID, MCC, MNC, LAC, RX Day, RX Week ,RX Month, TX Day, TX Week, TX Month, ICCID, WAN State, WAN IP, Temperature.
- Static monitoring - updates these parameters: IMEI, Model, Manufacturer, Revision, IMSI, Product Code, Batch Number, Hardware Revision.
- Hotspot monitoring - updates these parameters: Hotspot ID, Hotspot SSID, Hotspot Enabled, IP, Download, Upload, Download Limit, Upload Limit, Hotspot Users, Hotspot Users Pass, Hotspot User Active, Hotspot User Macs, Hotspot User Ips, Hotspot User Start Times, Hotspot User Use Times, Hotspot User Downloads, Hotspot User Uploads.
- I/O monitoring - updates these parameters: Digital Input, Digital Isolated Input, Analog Input, Digital OC Output, Digital Relay Output, Relay CFG, Output CFG.
- GPS monitoring - GPS monitoring updates these parameters: Latitude, Longitude, FIX, Altitude, Speed, Satellites, Course, Status, Enabled, Accuracy.
- Wireless monitoring - updates these parameters: Access point status, SSID, sent/received bytes per session, client count, connected device name, connected device MAC address, connected device IP address.
Estimated monthly data usage
Estimated data usage calculates an estimate of monthly data usage based on the update period values specified above.


