Template:Create monitoring template: Difference between revisions
Appearance
| Line 1: | Line 1: | ||
| Line 5: | Line 6: | ||
#Click on <big>'''<span style="color:#0455a4">+ ADD</span>'''</big> button in the top of Monitoring templates page. | #Click on <big>'''<span style="color:#0455a4">+ ADD</span>'''</big> button in the top of Monitoring templates page. | ||
#In the next window, select the RutOS/TSWOS API version ''(based on device's firmware that will be assigned to this template)'' your monitoring template will be using. You can also choose to copy monitored parameters from your already existing custom monitoring template.<br> [[File:Create monitoring template1.png|border|class=tlt-border]] | #In the next window, select the RutOS/TSWOS API version ''(based on device's firmware that will be assigned to this template)'' your monitoring template will be using. You can also choose to copy monitored parameters from your already existing custom monitoring template.<br> [[File:Create monitoring template1.png|border|class=tlt-border|400px]] | ||
#After pressing next, you will be redirected to paramater selection. All parameters belong to their specific configuration section and some parameters even have their own sub-paramater values.<br> | #After pressing next, you will be redirected to paramater selection. All parameters belong to their specific configuration section and some parameters even have their own sub-paramater values.<br> | ||
#To test the output/values of paramaters you'd like to monitor, use <span style="color:#0455a4">'''TEST ENDPOINT'''</span> functionality: | #To test the output/values of paramaters you'd like to monitor, use <span style="color:#0455a4">'''TEST ENDPOINT'''</span> functionality: | ||
##Select the device on which you are testing you custom monitoring template:<br>[[File:Create monitoring template3.png|border|class=tlt-border]] | ##Select the device on which you are testing you custom monitoring template:<br>[[File:Create monitoring template3.png|border|class=tlt-border|400px]] | ||
##Click '''TEST''' to get the output from the desired configuration section endpoint:<Br>[[File:Create monitoring template4.png|border|class=tlt-border]] | ##Click '''TEST''' to get the output from the desired configuration section endpoint:<br>[[File:Create monitoring template5.png|border|class=tlt-border|400px]]<Br>[[File:Create monitoring template4.png|border|class=tlt-border|600px]] | ||
##Once you get the values of monitored parameter test request, you can select | ##Once you get the values of monitored parameter test request, you can select them into your monitoring template. You can also check Raw Data tab if you're interested in getting monitoring data via RMS API, here the output is displayed in '''JSON''' format. | ||
# | #All selected parameters that you wish to monitor will be listed on the right side. You can choose '''up to 200''' parameters. | ||
[[File:Create monitoring template2.png|border|class=tlt-border| | [[File:Create monitoring template2.png|border|class=tlt-border|800px]] | ||
Revision as of 09:04, 25 October 2024
Create new monitoring template
To monitor your own desired parameters, you firstly need to create a new monitoring template which will collect data from those selected parameters.
- Click on + ADD button in the top of Monitoring templates page.
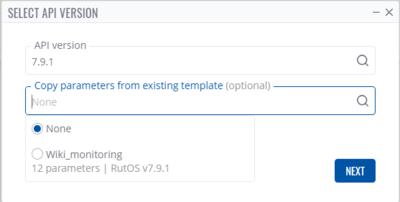
- In the next window, select the RutOS/TSWOS API version (based on device's firmware that will be assigned to this template) your monitoring template will be using. You can also choose to copy monitored parameters from your already existing custom monitoring template.

- After pressing next, you will be redirected to paramater selection. All parameters belong to their specific configuration section and some parameters even have their own sub-paramater values.
- To test the output/values of paramaters you'd like to monitor, use TEST ENDPOINT functionality:
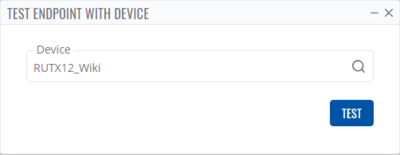
- Select the device on which you are testing you custom monitoring template:

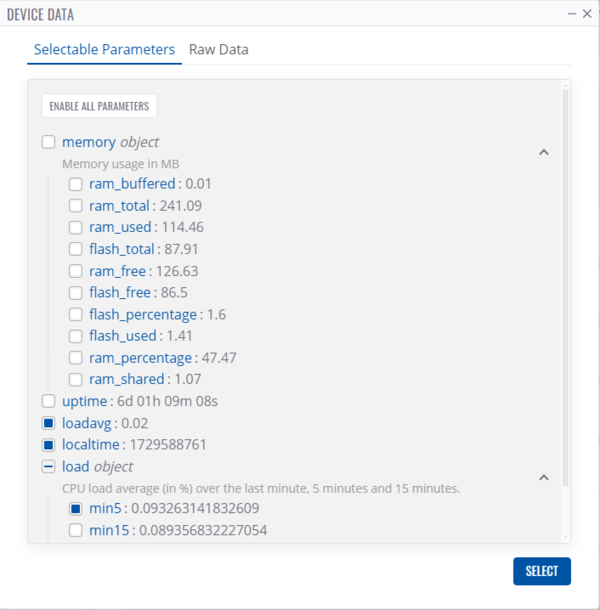
- Click TEST to get the output from the desired configuration section endpoint:


- Once you get the values of monitored parameter test request, you can select them into your monitoring template. You can also check Raw Data tab if you're interested in getting monitoring data via RMS API, here the output is displayed in JSON format.
- Select the device on which you are testing you custom monitoring template:
- All selected parameters that you wish to monitor will be listed on the right side. You can choose up to 200 parameters.

