RMS Wi-Fi & Hotspots: Difference between revisions
Appearance
No edit summary |
|||
| Line 1: | Line 1: | ||
__TOC__ | __TOC__ | ||
=WiFi & Hotspots= | =WiFi & Hotspots= | ||
The WiFi & Hotspots section is found under [[Draft:RMS Management|Management]], this section comprises of two main tabs - WiFi and Hotspots. It is used to monitor data usage, users, and connected devices using said services. | |||
To monitor these services, you must first enable '''Hotspot''' or '''Wireless monitoring''' in '''periodic monitoring update''': | To monitor these services, you must first enable '''Hotspot''' or '''Wireless monitoring''' in '''periodic monitoring update''': | ||
#On the left sidebar navigate to '''Managament -> Devices'''. | #On the left sidebar navigate to '''Managament -> Devices'''. | ||
Revision as of 11:38, 16 December 2022
Main Page > IoT Platforms > RMS > RMS Manual > RMS Management > RMS Wi-Fi & HotspotsWiFi & Hotspots
The WiFi & Hotspots section is found under Management, this section comprises of two main tabs - WiFi and Hotspots. It is used to monitor data usage, users, and connected devices using said services. To monitor these services, you must first enable Hotspot or Wireless monitoring in periodic monitoring update:
- On the left sidebar navigate to Managament -> Devices.
- Select devices you'd like to monitor
- Move mouse pointer to top menu, and under the Management submenu click on Set monitoring update period (Management menu -> Set monitoring update period).
- Enable monitoring of said services and choose their update period.
WiFi
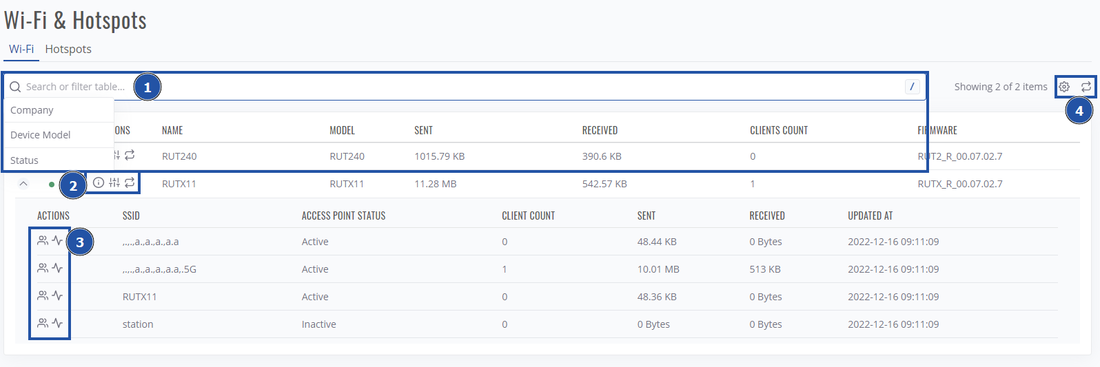
Once periodic Wireless update is enabled, you'll see a list of WiFi interfaces in the Wi-Fi tab:
Here, you'll be able to:
- Search by Device name, filter by device model, status, company.
- Do various actions such as view device details, access WebUI, update device information on devices on which WiFi monitoring is enabled.
- Monitor WiFi interface: view its active users or view its data usage multichart.

- Change table parameters and update all data.
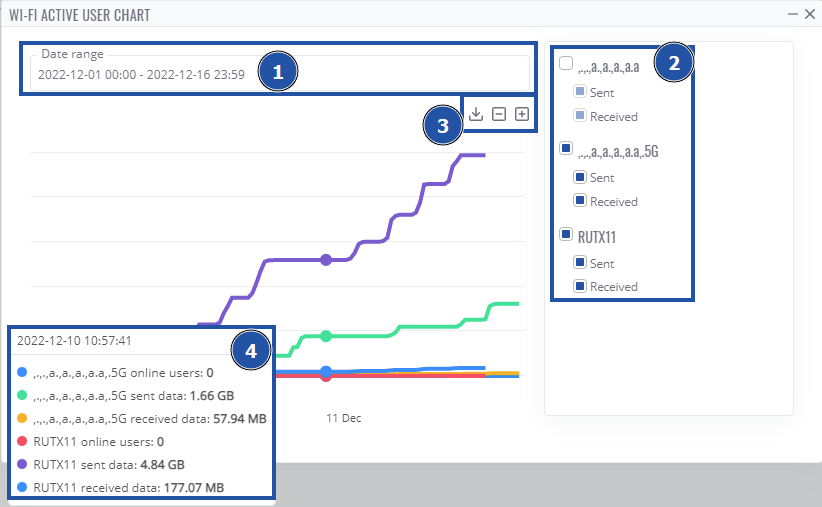
WiFi Multichart
Using the tools you can list the active users and actively monitor network data flow.

In this graph you can:
- Define specific monitoring date range.
- Select specific WiFi interfaces and their parameters.
- Export chart data, zoom in/out.
- View specific details by hovering on the timeline.
Hotspots
Once periodic Hotspot update is enabled, you'll see a list of hotspots in the Hotspots tab:
 Here, you'll be able to:
- Search by hotspot's SSID, device name, filter by device model, status and company.
- Various actions on specific hotspot: view connected users, view all existing users, add a new user.
- Same device actions like in WiFi list: view device details, access WebUI, update device information.
- Change table parameters and update all data

