Monitoring via Zabbix: Difference between revisions
mNo edit summary |
mNo edit summary |
||
| Line 122: | Line 122: | ||
[[File:Monitoring via Zabbix SNMP2 router v1.png|941x941px]] | [[File:Monitoring via Zabbix SNMP2 router v1.png|border|class=tlt-border|941x941px]] | ||
===Adding SNMPv2 host to Zabbix front-end=== | ===Adding SNMPv2 host to Zabbix front-end=== | ||
| Line 171: | Line 171: | ||
[[File:Monitoring via Zabbix SNMP3 router v1.png|939x939px]] | [[File:Monitoring via Zabbix SNMP3 router v1.png|border|class=tlt-border|939x939px]] | ||
| Line 184: | Line 184: | ||
[[File:Monitoring via Zabbix SNMP3 user router v1.png|1041x1041px]] | [[File:Monitoring via Zabbix SNMP3 user router v1.png|border|class=tlt-border|1041x1041px]] | ||
===Adding SNMPv3 host to Zabbix front-end=== | ===Adding SNMPv3 host to Zabbix front-end=== | ||
Revision as of 10:34, 17 January 2023
Main Page > General Information > Configuration Examples > Router control and monitoring > Monitoring via ZabbixSummary
The information in this page is updated in accordance with the RUTXXX_R_00_07_03 firmware version.
Zabbix is an open-source monitoring software tool for diverse IT components, including networks, servers, virtual machines (VMs) and cloud services. It provides monitoring metrics, such as network utilization, CPU load and disk space usage, as well as uptime and response time. It can also be used to monitor various network services such as SMTP, POP3, HTTP, and SNMP. Zabbix is one of the most widely used open-source monitoring software, It is free and support large scale of environments with Enterprise level features. It has a web-based front-end, along with a back-end server written in C, which makes it platform-independent and able to run on a wide range of operating systems, including Linux, Windows, and macOS.
In this example, we will attempt to monitor Teltonika-Networks devices using Zabbix agent as well as SNMPv2 and SNMPv3 with authentication.
Configuration Overview & Prerequisites
For this example, we will need:
- Teltonika-networks router - RUTX11 will be used in this example
- Zabbix server
Preparing Zabbix Server
There are several ways to install the Zabbix server, depending on your operating system and environment. Here are a few common methods:
- Package manager: On Linux distributions such as Red Hat, CentOS, Debian, and Ubuntu, you can install the Zabbix server using the package manager. This is the easiest and most common way to install Zabbix. For example, on Ubuntu, you can use the command: sudo apt-get install zabbix-server-mysql zabbix-frontend-php
- Source installation: You can also install Zabbix from the source code. This method allows you to customize your installation and install the latest version of Zabbix. You will need to download the source code from the Zabbix website, and then compile and install it on your system.
- Docker: Zabbix has an official Docker image, which allows you to run the Zabbix server in a container. This is a useful option for testing or for environments where you want to minimize the number of installed packages on the host system.
- Virtual Appliance: Zabbix also provides ready to use Virtual Appliance with the pre-installed Zabbix server. This can be used in environments such as VMware or VirtualBox.
- Cloud Image: Zabbix also provides pre-configured image for different cloud provider like AWS,Azure,GCP. This can be used to quickly deploy Zabbix monitoring on cloud environments.
No matter which method you choose, you will also need to set up a database for the Zabbix server to use, and configure the PHP front-end for the web interface. The specific steps for these tasks will vary depending on your operating system and environment, but you can find detailed instructions in the Zabbix documentation.
In this example, we have Zabbix server set up using Docker container method and PostgreSQL database on Windows 10 + WSL Ubuntu 22.04 LTS. Instructions can be found in official Zabbix documentation: https://www.zabbix.com/documentation/current/en/manual/installation/containers
Once Zabbix server is up and running, we can start adding Hosts.
Monitoring Using Agent
The Zabbix agent is a small program that runs on the hosts that you want to monitor. Its role is to collect various data from the host, such as performance metrics, log files, and system information, and then send this data to the Zabbix server. This allows the server to analyze the data and create alerts, graphs, and reports based on it.
The Zabbix agent is typically installed on the same machine as the Zabbix server, but it can also be installed on remote hosts, such as servers, workstations, or network devices. It can run on a wide variety of platforms, including Linux, Windows, macOS, and even embedded systems.
In this example, Zabbix agent will be installed as a package on the RutOS operating system.
Installing and Configuring Zabbix Agent
In order to install Zabbix agent on our router, we will need to access the Command Line Interface. Refer to the following article to find our how: https://wiki.teltonika-networks.com/view/Command_Line_Interfaces_RutOS
Once in CLI, execute the following commands in order to install the agent daemon:
opkg update
opkg install zabbix-agentd
Next, use your favourite editor to open the configuration file:
nano /etc/zabbix_agentd.conf
Once we have zabbix_agentd.conf opened, we will need to change the "Server" value and set it to the IP address of the Zabbix server:
Server=192.168.1.220
Additionally, add ListenPort and Hostname values:
ListenPort=10050
Hostname=RUTX11
Note: We are listening on port 10050 because passive agent is used in this example, if you wish to use active agent, 10051 port should be used.
Save the changes in the configuration file and restart the daemon:
/etc/init.d/zabbix-agentd restart
Adding Agent Host to Zabbix front-end
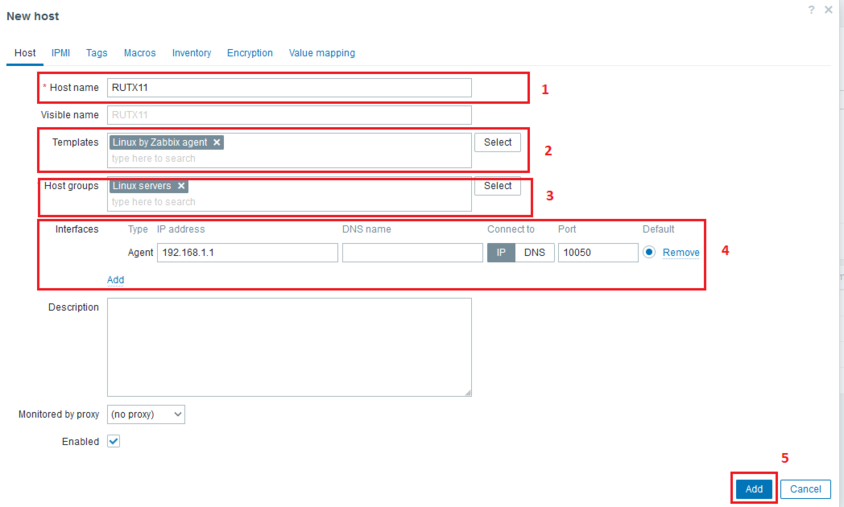
Once we have agent set-up on the router, we will add it as host in the zabbix server. In order to do so login to the front-end of the Zabbix server and navigate to Monitoring → Hosts on the left hand menu. Click on the Create host button in the right-hand corner of the screen. A window will pop-up where we will configure the host accordingly:
- Hostname: RUTX11
- Templates: Templates/Operating systems → Linux by Zabbix agent
- Host groups: Linux servers
- Interfaces: Click Add, select Agent and input IP address of the router
- Leave other settings as default and press Add to save settings.
The router is now added as a host and you should see it in the list of monitored devices:
Now we can see what information are we getting from the router.
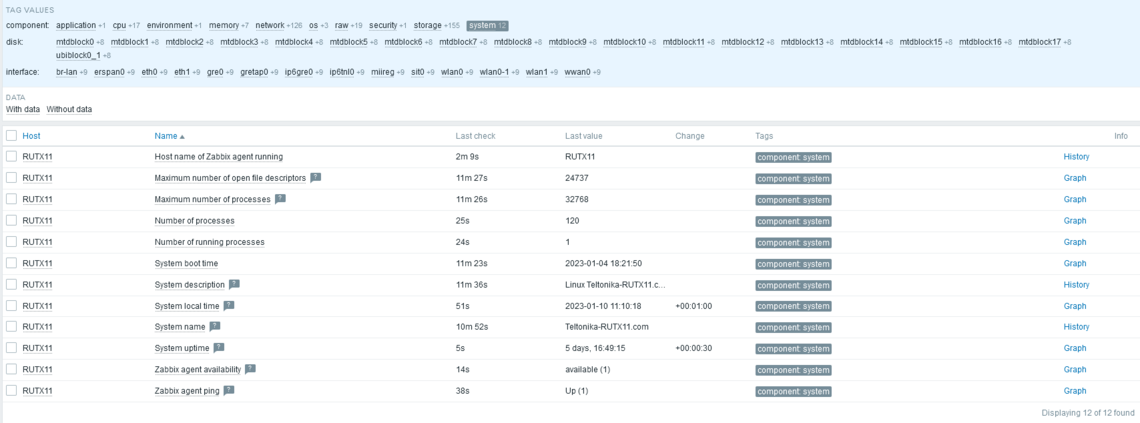
In order to view raw data, select Latest data where you will be redirected to another page with different sorts of data collected from the router. Here is an example of system information:
In order to see graphs, click on Graphs in the host list. Here is an example of Mobile interface data:
Monitoring via SNMP
SNMP provides a simpler way to monitor network devices, but it has some limitations. SNMP data collection is mostly based on pre-defined OIDs, it might not provide detailed information or the information is not available in the OID, whereas Zabbix Agent can be configured to collect specific data and provide more detailed information.
It's possible to use both SNMP and Zabbix agent to monitor the same device in conjunction to get the most complete and detailed view of the device.
SNMPv2 Router Configuration
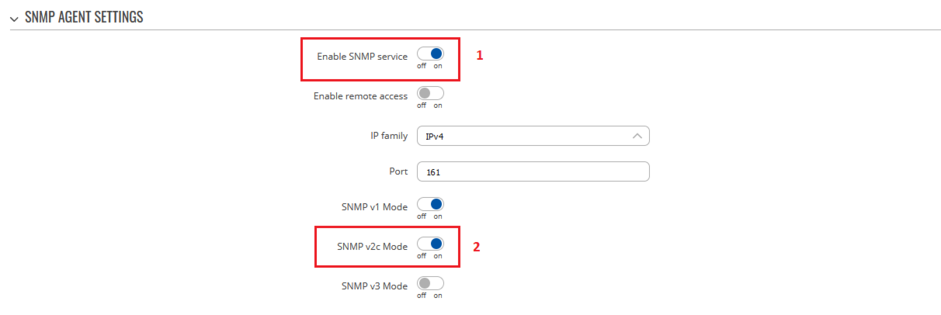
Navigate to Services > SNMP:
- Enable SNMP service
- Enable SNMP v2c Mode
- Leave other settings as default
Adding SNMPv2 host to Zabbix front-end
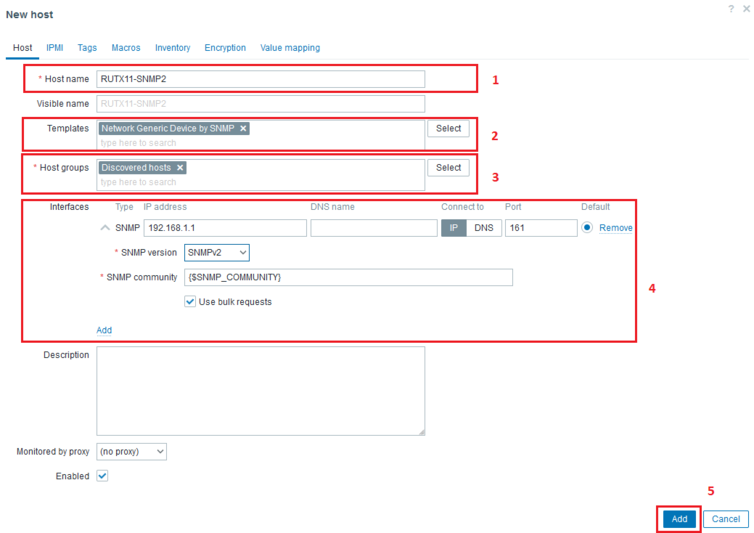
Once we have SNMPv2 enabled on the router, we will add it as host in the zabbix server. In order to do so login to the front-end of the Zabbix server and navigate to Monitoring → Hosts on the left hand menu. Click on the Create host button in the right-hand corner of the screen. A window will pop-up where we will configure the host accordingly:
- Hostname: RUTX11-SNMP2
- Templates: Templates/network devices → Network Generic Device by SNMP
- Host groups: Discovered hosts
- Interfaces: Click Add, select SNMP, input IP address of the router and chose SNMPv2 version.
- Leave other settings as default and press Add to save settings.
The router is now added as a host using SNMP v2 and you should see it in the list of monitored devices:
Now we can see what information are we getting from the router.
In order to view raw data, select Latest data where you will be redirected to another page with different sorts of data collected from the router. Here is an example of wwan0 interface:
In order to see graphs, click on Graphs in the host list. Here is an example of LAN interface data:
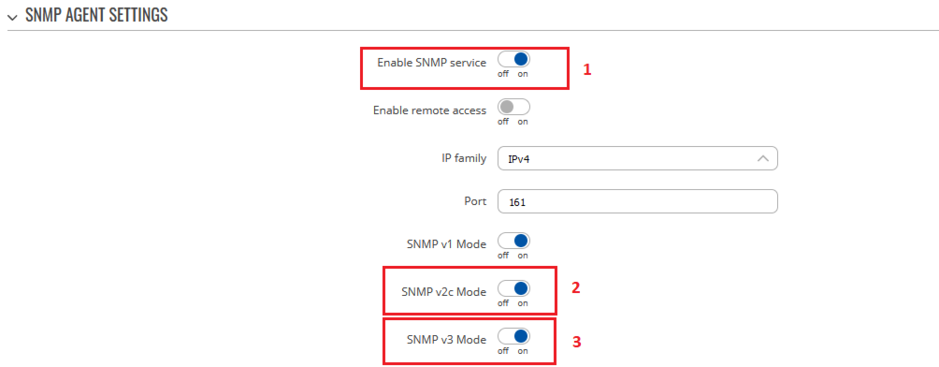
SNMPv3 Router Configuration
SNMP v3 provides more security features than v2, making it more suitable for use in secure network environments. Zabbix and Teltonika routers both support SNMPv3. Router configuration is as follow:
Navigate to Services > SNMP:
- Enable SNMP service
- Enable SNMP v2c Mode
- Enable SNMP v3 Mode
- Leave other settings as default
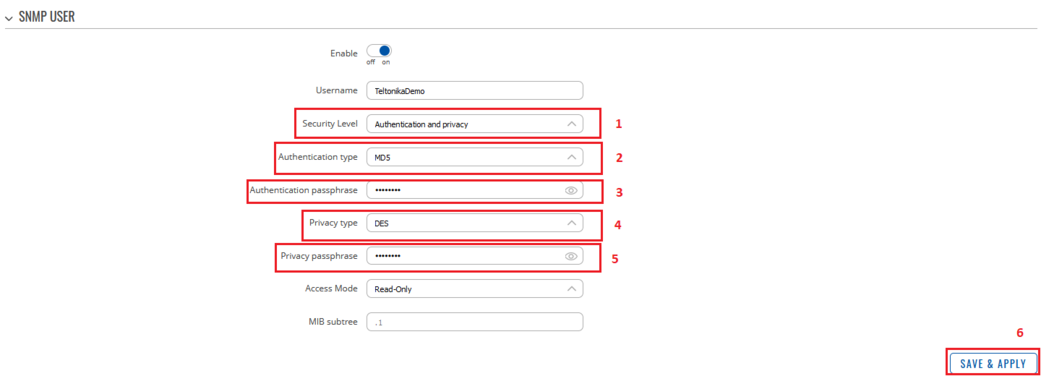
Navigate to Services > SNMP > SNMPv3 Users and add new instance with authentication information:
- Security Level: Authentication and privacy
- Authentication type: MD5
- Create an authentication passphrase
- Privacy type: DES
- Create Privacy passphrase
- Leave other settings as default, Save & Apply settings
Adding SNMPv3 host to Zabbix front-end
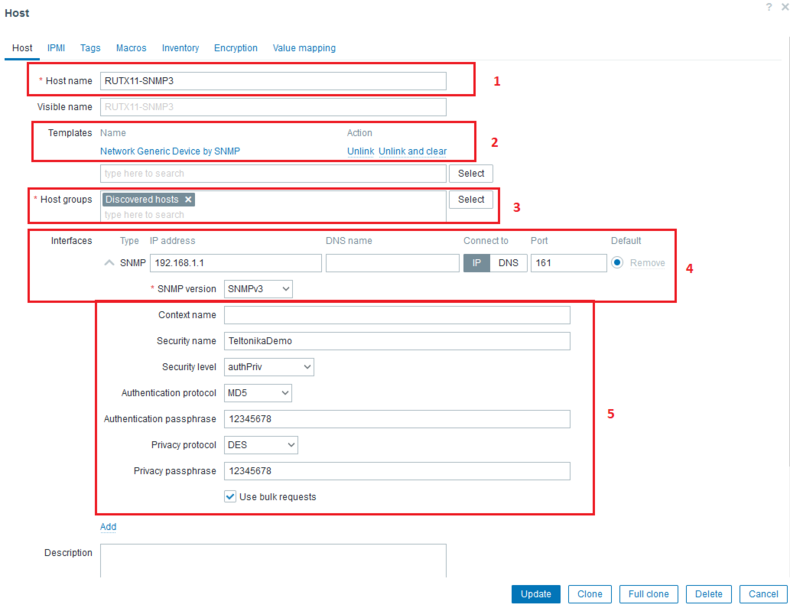
Once we have SNMPv3 setup on the router, we will add it as host in the zabbix server. In order to do so login to the front-end of the Zabbix server and navigate to Monitoring → Hosts on the left hand menu. Click on the Create host button in the right-hand corner of the screen. A window will pop-up where we will configure the host accordingly:
- Hostname: RUTX11-SNMP3
- Templates: Templates/network devices → Network Generic Device by SNMP
- Host groups: Discovered hosts
- Interfaces: Click Add, select SNMP, input IP address of the router and chose SNMPv3 version.
- Enter required authentication data from the router.
- Leave other settings as default.
The router is now added as a host using SNMP v2 and you should see it in the list of monitored devices:

