Template:Networking rutos manual troubleshoot: Difference between revisions
No edit summary |
No edit summary |
||
| Line 17: | Line 17: | ||
</tr> | </tr> | ||
<tr> | <tr> | ||
<td>External system log server</td> | <td>External system log server Hostname</td> | ||
<td>host:port; default: <b>none</b></td> | <td>host:port; default: <b>none</b></td> | ||
<td>IP address/host and port of an external server that will be used to store device logs.</td> | <td>IP address/host and port of an external server that will be used to store device logs.</td> | ||
Revision as of 14:38, 12 April 2024
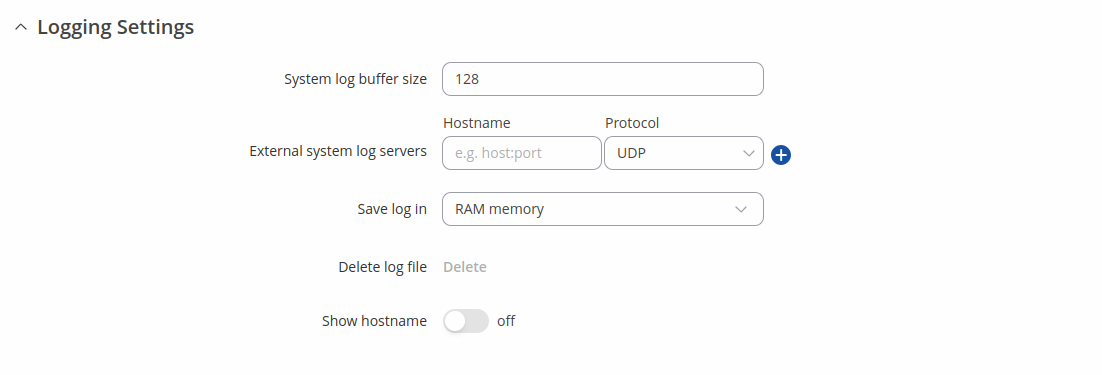
Logging Settings
The Logging Settings section is used to configure how and where the device stores system log data. The system log is a file that contains information on various system related events and is useful to engineers for troubleshooting the device.
| Field | Value | Description |
|---|---|---|
| System log buffer size | integer; default: 128 | System log buffer size in kibibytes (KiB). |
| External system log server Hostname | host:port; default: none | IP address/host and port of an external server that will be used to store device logs. |
| External system log server protocol | UDP | TCP; default: UDP | Communication protocol used by the external log server. |
| Save log in | RAM memory | Flash memory; default: RAM memory | Specifies which type of memory to use for storing system logs. |
| System log file size | integer [10..500]; default: 200 | Maximum size (in kilobytes) of a log file. When threshold is reached, log rotation is performed. Can be set to value from 10kB to 500kB. Smaller the file, larger amount of old logs is saved. |
| Compress | off | on; default: off | Compress old rotated logs using GZ format. |
| Delete | - (interactive button) | Deletes log file from router. |
| Show hostname | off | on; default: off | Show hostname instead of IP address in syslog. |
Troubleshoot
The Troubleshoot section is used to download various files that contain information used for troubleshooting the device. Refer to the figure and table below for information on the Troubleshoot page.

| Field | Value | Description |
|---|---|---|
| System log | - (interactive button) | Displays the contents of the device system log file. The system log contains records of various system related events, such as starts/stops of various services, errors, reboots, etc. |
| Kernel log | - (interactive button) | Displays the contents of the device kernel log file. The kernel log contains records of various events related to the processes of the operating system (OS). |
| Troubleshoot file | - (interactive button) | Downloads the device Troubleshoot file. It contains the device configuration information, logs and some other files. When requesting support, it is recommended to always provide the device Troubleshoot file to Teltonika engineers for analysis. |
| TCP dump file* | - (interactive button) | Downloads the device TCP dump file. TCP dump is a program used to capture packets moving through network interfaces. By default, the device does not store TCP dump information. You must enable TCP dump and save the changes before you can download the file. |
| Enable TCP dump* | off | on; default: off | Turns TCP dump packets capture on or off. |
* As of {{{series}}}_R_00.07.00, TCPdump is not part of core functionality anymore. To see these options, the TCPdump package must be downloaded from [[{{{name}}}_Package_Manager|Package Manager]].
TCP dump
TCP dump is an optional downloadable functionality* used to capture packets moving through network interfaces. By default, the device does not store TCP dump information. You must enable TCP dump and save the changes before you can download the file.
If you enable TCP dump, you will notice additional configuration fields appear. Refer to the figure and table below for realted information.
* You can download the TCPdump package from [[{{{name}}}_Package_Manager|Package Manager]].
| Field | Value | Description |
|---|---|---|
| Enable TCP dump | off | on; default: off | Turns TCP dump packet capture on or off. |
| Select interface | network interface; default: br-lan | Only captures packets that move through the specified network interface. |
| Select protocol filter | All | ICMP | TCP | UDP | ARP; default: All | Only captures packets that match the specified protocol. |
| Select packets direction | Incoming/Outgoing | Incoming | Outgoing; default: Incoming/Outgoing | Only captures packets coming from the specified direction. |
| Host | ip | host; default: none | Only captures packets related to the specified host. |
| Port | integer [0..65335]; default: none | Only captures packets related to the specified communication port. |
| Select storage | RAM memory; default: RAM memory | Specifies where the TCP dump file will be stored. |
Diagnostics
The Diagnostics section is used to execute simple network diagnostic tests, including ping, traceroute and nslookup.
| Field | Value | Description |
|---|---|---|
| Method | Ping | Traceroute | Nslookup; default: Ping | Selects diagnostic method.
|
| Protocol | IPv4 | IPv6; default: IPv4 | Selects IP address family for diagnostic test. |
| Address | ip | host; default: none | IP address or hostname on which the diagnostic test will be performed. |
| Perform | -(interactive button) | Performs diagnostic test when clicked. |


