RMS Interface Guide: Difference between revisions
| Line 81: | Line 81: | ||
In the main content for this tab has three different areas. | In the main content for this tab has three different areas. | ||
* '''Charts''' – displays a list of devices information in a graphical way. Shows all the pie charts that were selected in Chart options in the right | * '''Charts''' – displays a list of devices information in a graphical way. Shows all the pie charts that were selected in Chart options in the right customization panel. | ||
* '''Devices map''' - clicking on the map enlarge icon will expand a world map with devices located on their approximate locations. | * '''Devices map''' - clicking on the map enlarge icon will expand a world map with devices located on their approximate locations. | ||
* '''Table section''' - clicking on the map enlarge icon will expand a world map with devices located on their approximate locations. | * '''Table section''' - clicking on the map enlarge icon will expand a world map with devices located on their approximate locations. | ||
Charts and table section both can be filtered and changed using the right | Charts and table section both can be filtered and changed using the right customization panel. For example, we can change what kind of columns will be shown in the table section. | ||
==Settings panel and search field== | ==Settings panel and search field== | ||
Revision as of 12:03, 27 May 2019
Main Page > IoT Platforms > RMS > RMS Interface GuideSummary
Watch the video below to learn about the main features of the Teltonika RMS user interface.
You can create an RMS account on https://rms.teltonika.lt
The page contains information about the user interface for Teltonika Remote Management Support (RMS) for the Teltonika devices. Here you will find an overview of all five elements of RMS user interface. The goal of this page is to familiarise first time users with the main elements of the RMS interface.
Five main elements
The first time you open the RMS web page, it will have fewer elements before you add your first device. To see all the elements of the user interface and to get full functionality, you will have to add at least one device.
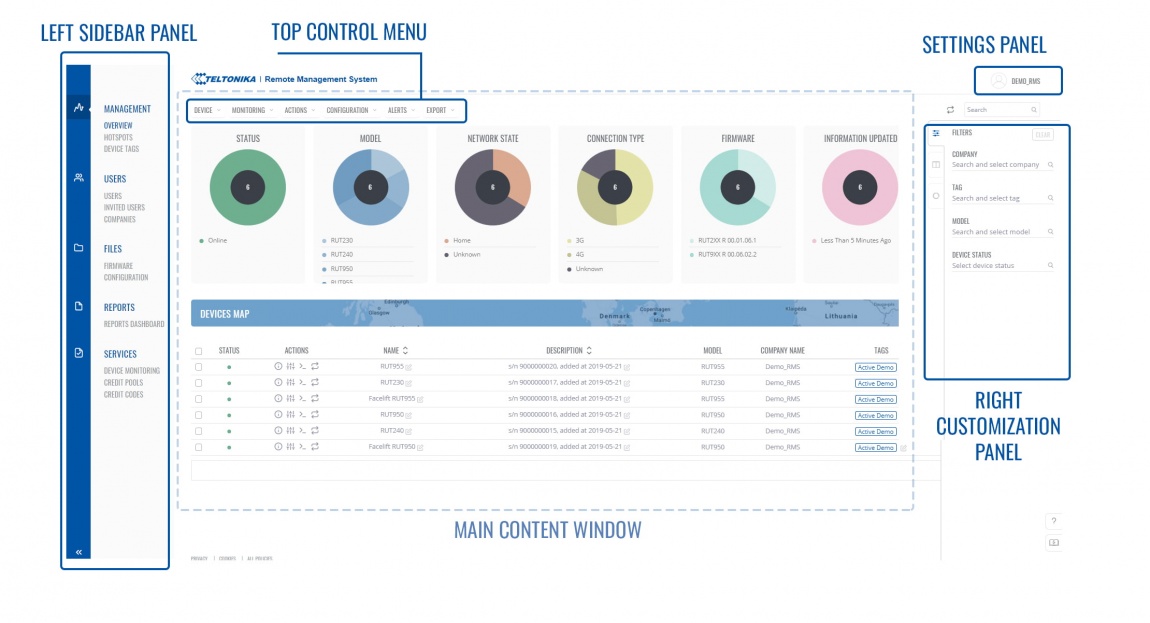
The main page of RMS consists of five main user interface elements. Manipulating left sidebar panel, top control menu and right customization panel you will see all the information in the main content window in the center of your screen.
- Left sidebar panel - provides access to different sections of RMS. Management, Users, Files, Reports, Licenses.
- Top control menu - Here you will find all options and controls depending on which tab of the left sidebar is currently selected.
- Right customization panel - Allows you to filter and customize what kind of data you will see in the main content window.
- Main content window - Shows all the data and corresponds to your selection on the left sidebar panel and customization of the right panel.
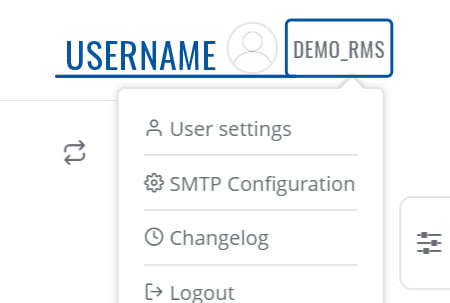
- Settings panel - Location for your RMS account username, user and profile settings and the option to log out.
Left sidebar panel
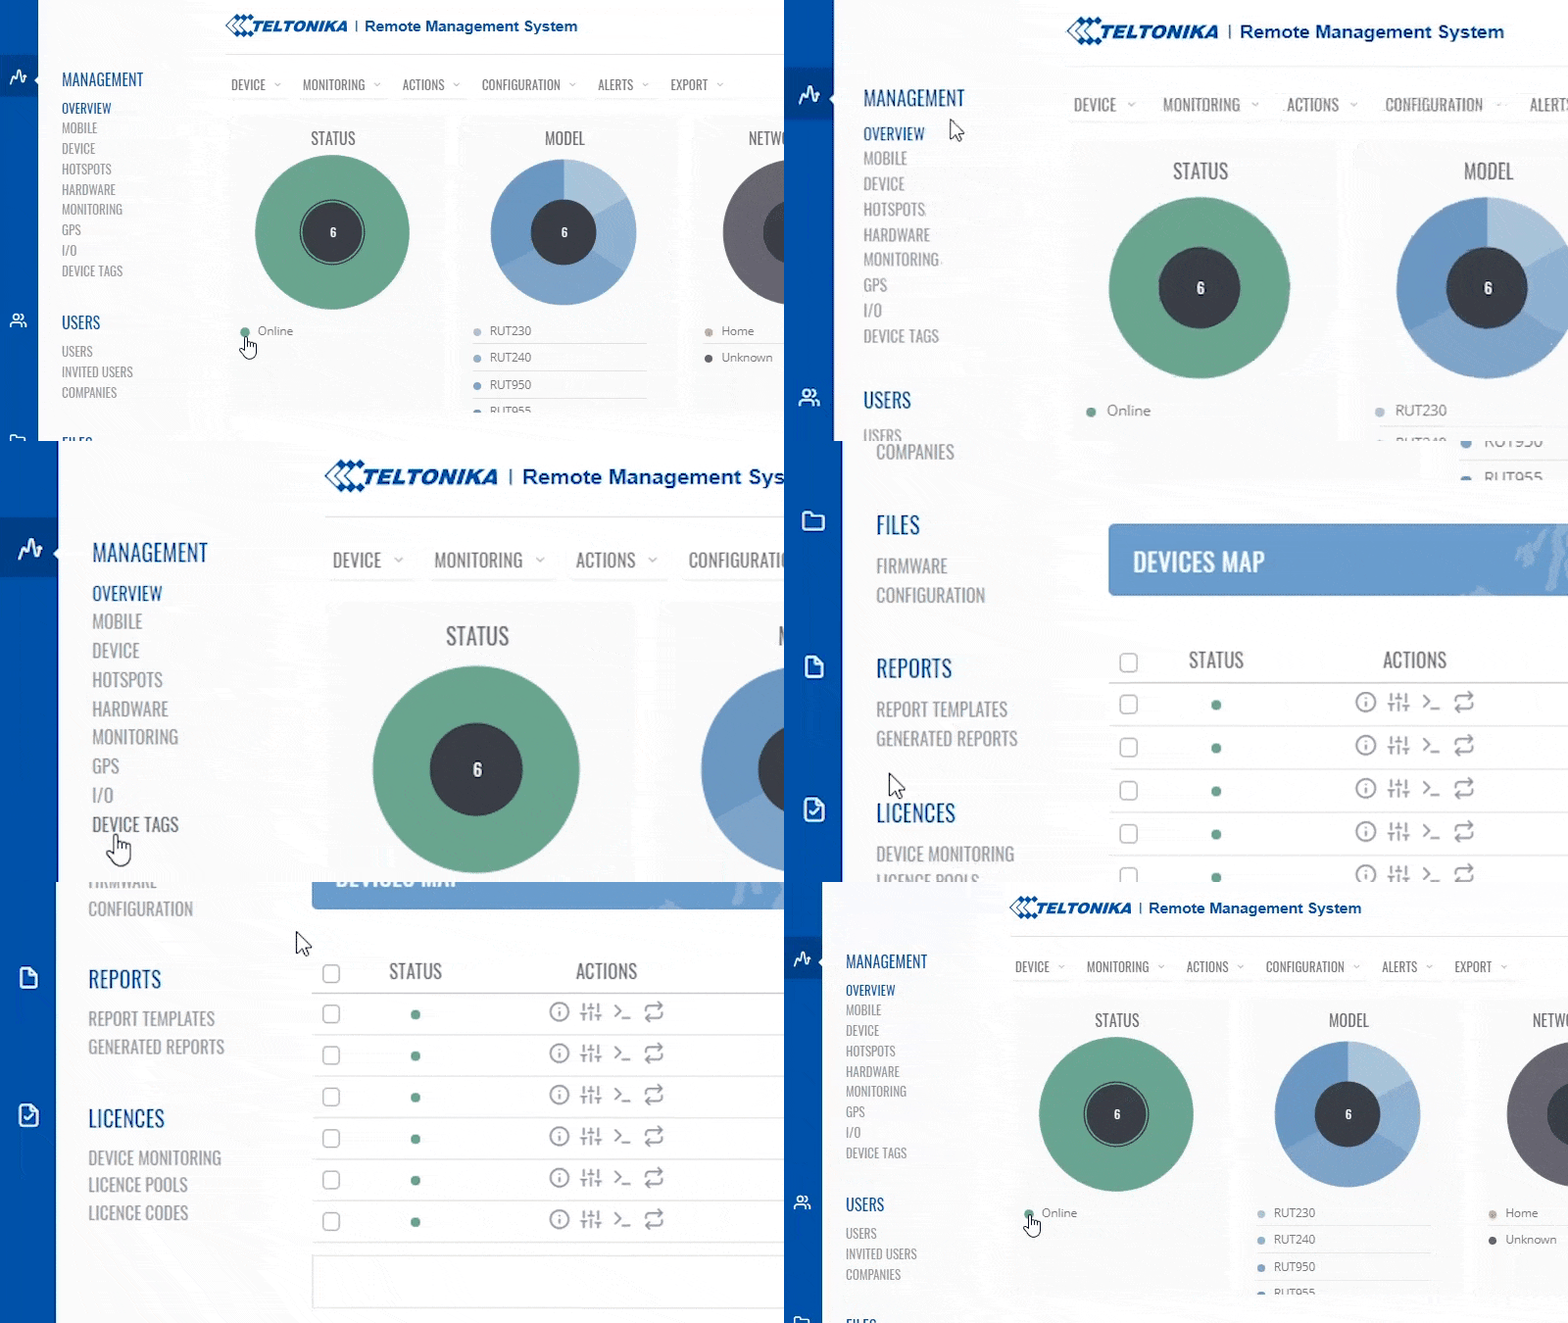
Left sidebar panel tabs provide access to different sections of RMS. This is the main section of the RMS user interface, and it will always control the type of information you will see on the screen.
It consists of:
- Management — tab is your main tool of RMS. From here you can manage, monitor, update and configure all your devices.
- Users — tab is used to manage RMS users and companies.
- Files — tab is for managing custom firmware files and configuration backup files.
- Reports — from this tab you can generate and store device reports.
- Licenses — tab allows controlling device monitoring options and RMS license usage.
Each section of left sidebar panel. Has a subsection with specific topics for those specific sections.
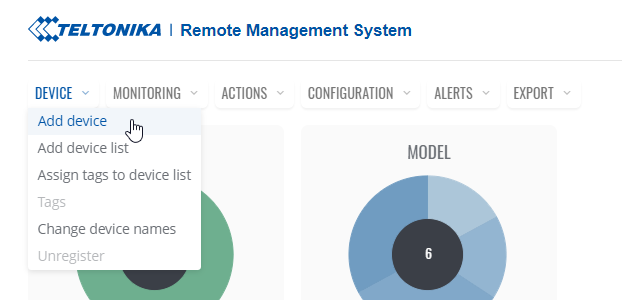
In the Top control menu, you will find all options and controls depending which tab of the left sidebar is currently selected.
While on management tab, top control menu allows you to control and manage devices. It will show Device, Monitoring, Actions, Configuration, Alerts and Export menus. Except for the Hotspots and Device tags sections. Hotspot does not have any menu and Device tags sections have Tags menu.
Users tab gives options to manage users and companies. And you will get User, Invitations and Company menus depending which left sidebar panel subsection is selected.
The files tab will give you a File menu where you can manage your firmware and configuration files.
Reports tab does not have any menu options in the Top control menu.
Licenses tab has a special menu for monitoring, license pools, and license codes options.
Right customization panel
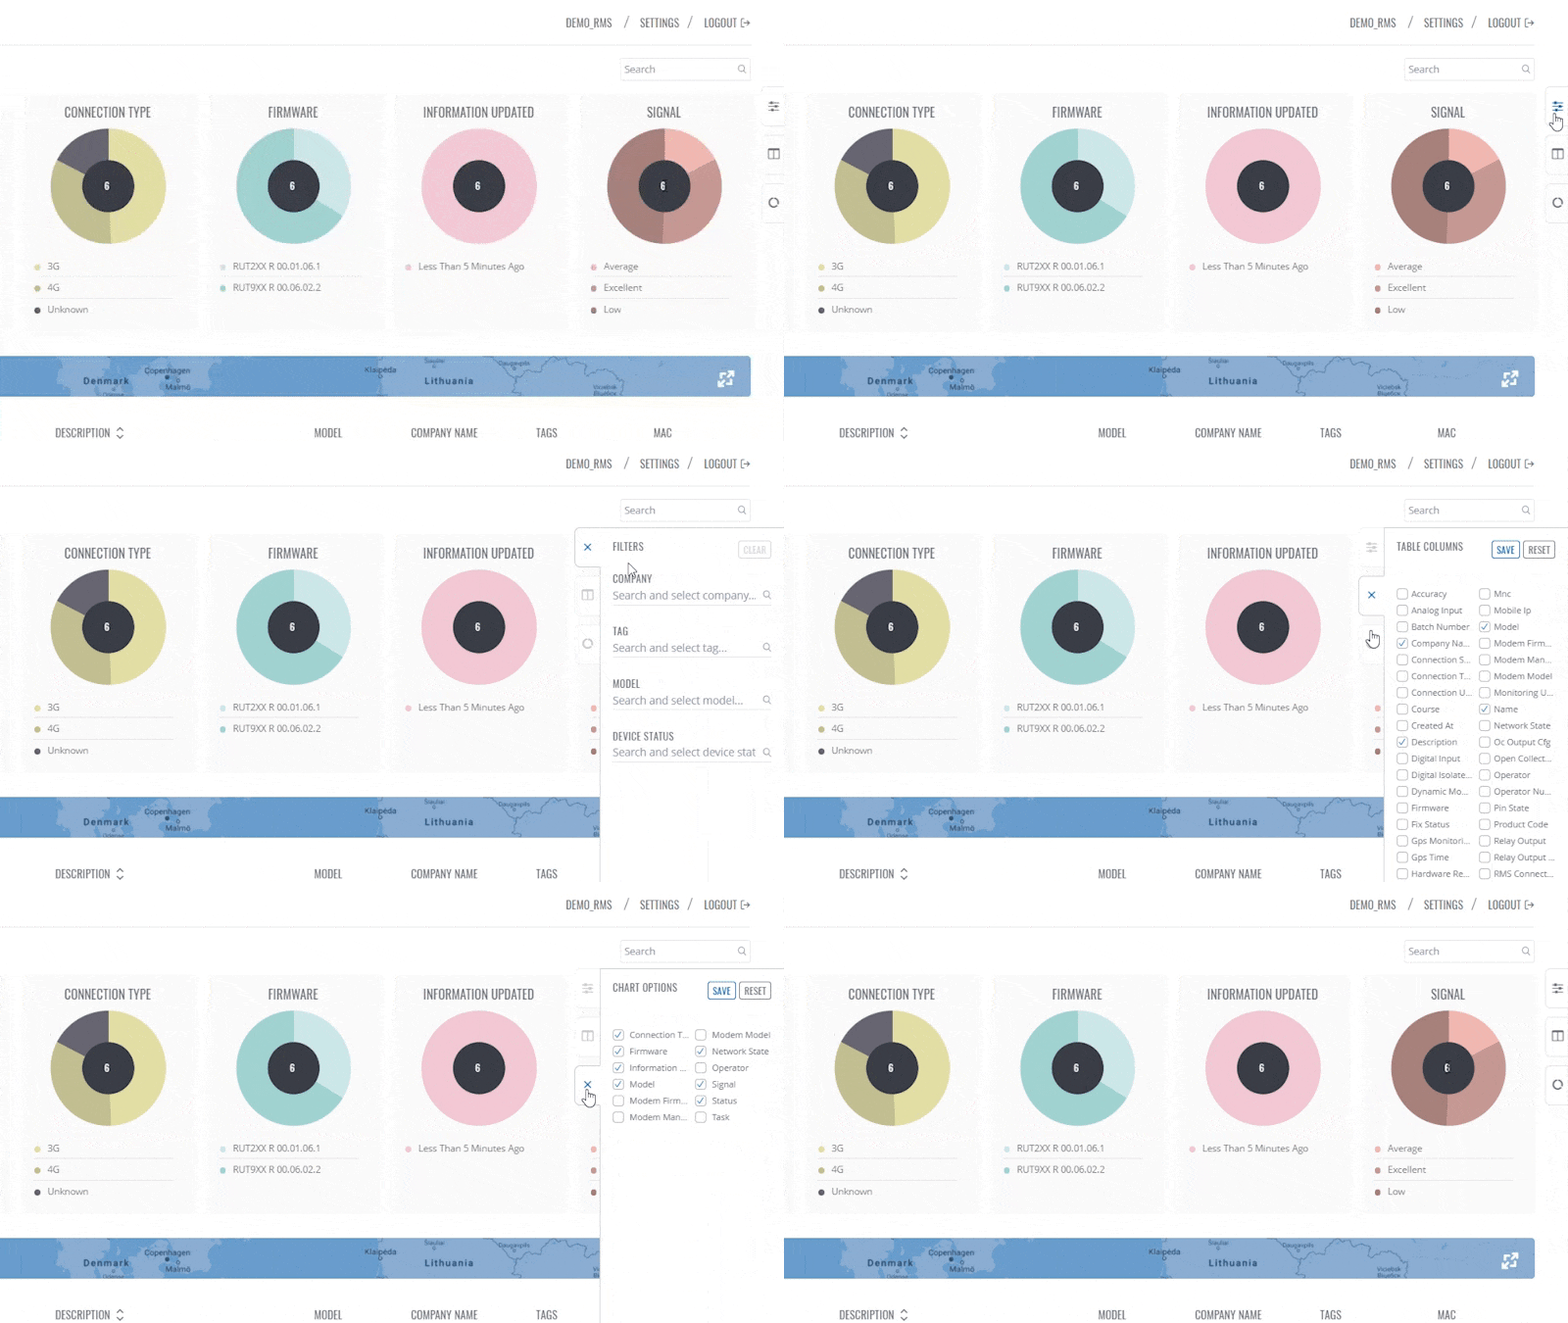
Right customization panel allows to filter and customize what kind of data you will see in the main content window.
In the filters tab, we can filter for companies, tags, models and device status.
Table columns tab gives you a lot of different options to choose specific columns you want to see in the main content window.
The tab for Chart options provides you with options to select the different charts you want to be displayed on the top of your screen.
Main content window
Similarly to the top control menu, the main content window corresponds to your selection on the left sidebar panel.
In the main content for this tab has three different areas.
- Charts – displays a list of devices information in a graphical way. Shows all the pie charts that were selected in Chart options in the right customization panel.
- Devices map - clicking on the map enlarge icon will expand a world map with devices located on their approximate locations.
- Table section - clicking on the map enlarge icon will expand a world map with devices located on their approximate locations.
Charts and table section both can be filtered and changed using the right customization panel. For example, we can change what kind of columns will be shown in the table section.
Settings panel and search field
In the top right corner, you will find the settings panel. Here you will see your username, settings and the option to log out. In the settings panel, you will find user and profile settings.
The Search field is located just below the settings panel. You can use the search field to filter devices by the information in name, description, serial, mac and other columns.

