Template:Rms manual management monitoring submenu configuration: Difference between revisions
Appearance
No edit summary |
No edit summary |
||
| Line 4: | Line 4: | ||
<br> | <br> | ||
[[File:RMS Monitoring Set Update Period.gif]] | |||
[[File:gif]] | |||
===Step by step instructions=== | ===Step by step instructions=== | ||
| Line 13: | Line 10: | ||
* First, choose a device(s) for which the configuration will apply. | * First, choose a device(s) for which the configuration will apply. | ||
* Move your mouse pointer to the Monitoring submenu (found in '''Management → Monitoring''') and click "Configuration": | * Move your mouse pointer to the Monitoring submenu (found in '''Management → Monitoring''') and click "Configuration": | ||
* After | * After a new pop-up window should appear. Place check marks next to relevant parameters to set up custom monitoring intervals. On the right you can set up the monitoring update frequency; on the left, you can set the time units for that frequency. As you change these settings, an '''estimated monthly data usage''' value will be calculated below in real time: | ||
* '''Dynamic Monitoring''' - every varying router parameter (e.g., uptime, mobile uptime, modem temperature, etc.). | * '''Dynamic Monitoring''' - every varying router parameter (e.g., uptime, mobile uptime, modem temperature, etc.). | ||
Revision as of 15:58, 27 June 2019
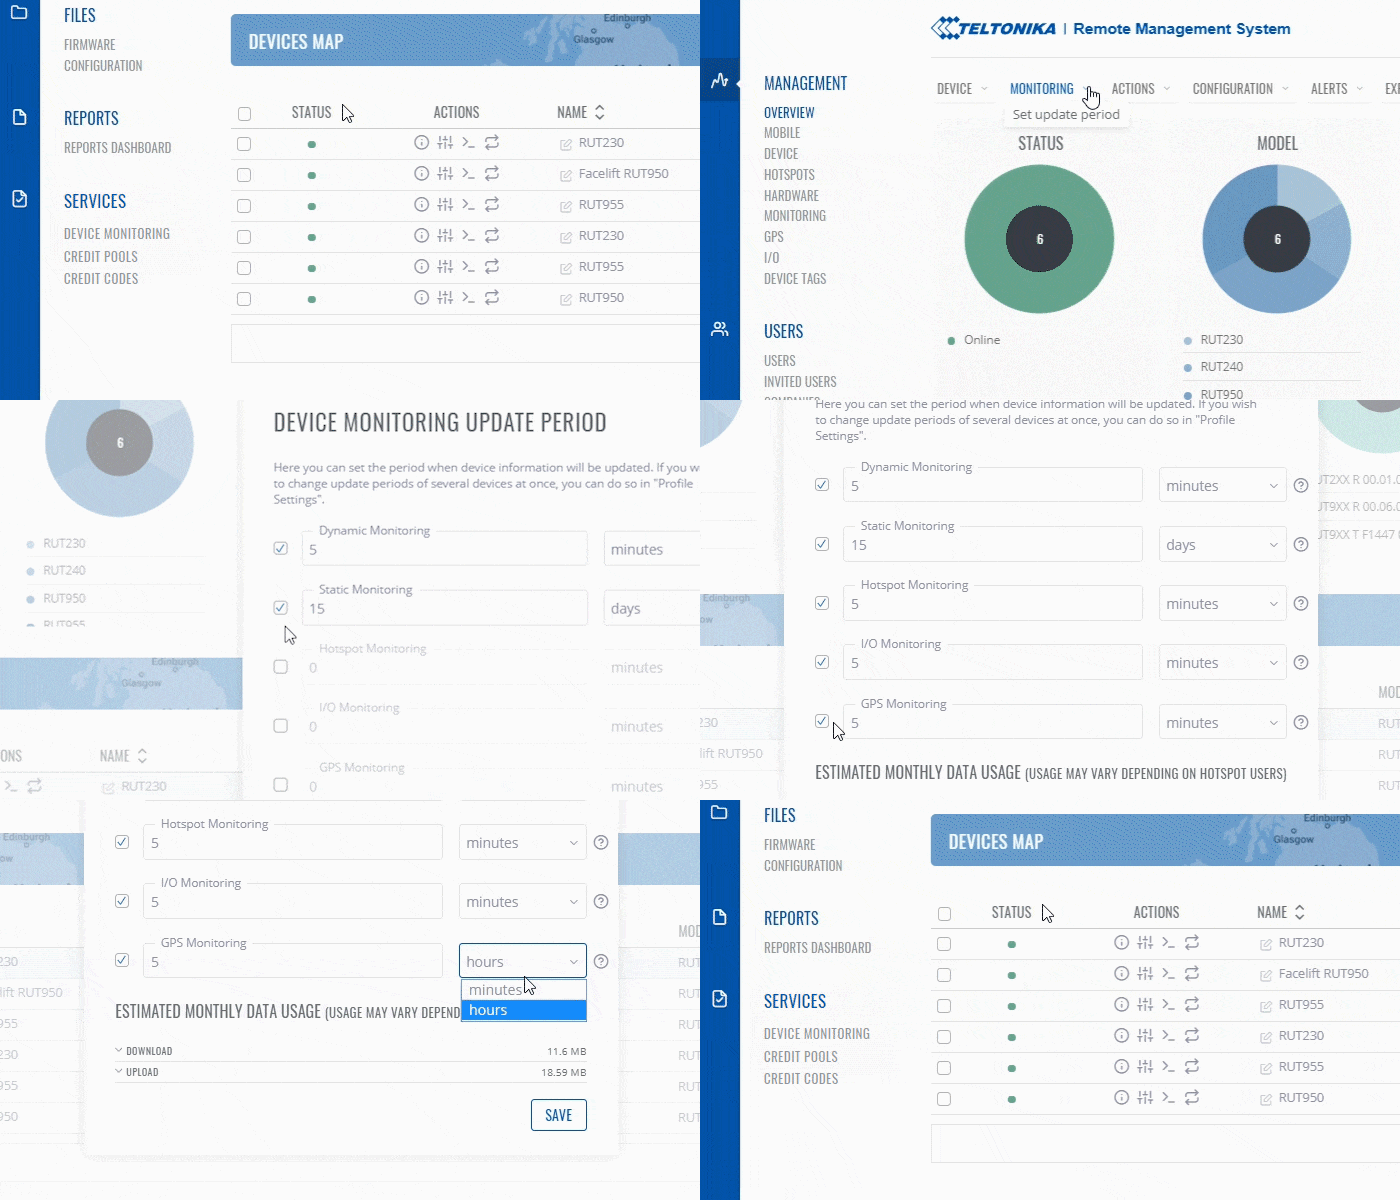
To change monitoring options for your device go to the RMS web page, Left sidebar panel (Management → Overview) and click on Overview submenu.
Move your mouse pointer to the Top control Devices menu and select Set update period (Devices → Set update period).
Step by step instructions
- First, choose a device(s) for which the configuration will apply.
- Move your mouse pointer to the Monitoring submenu (found in Management → Monitoring) and click "Configuration":
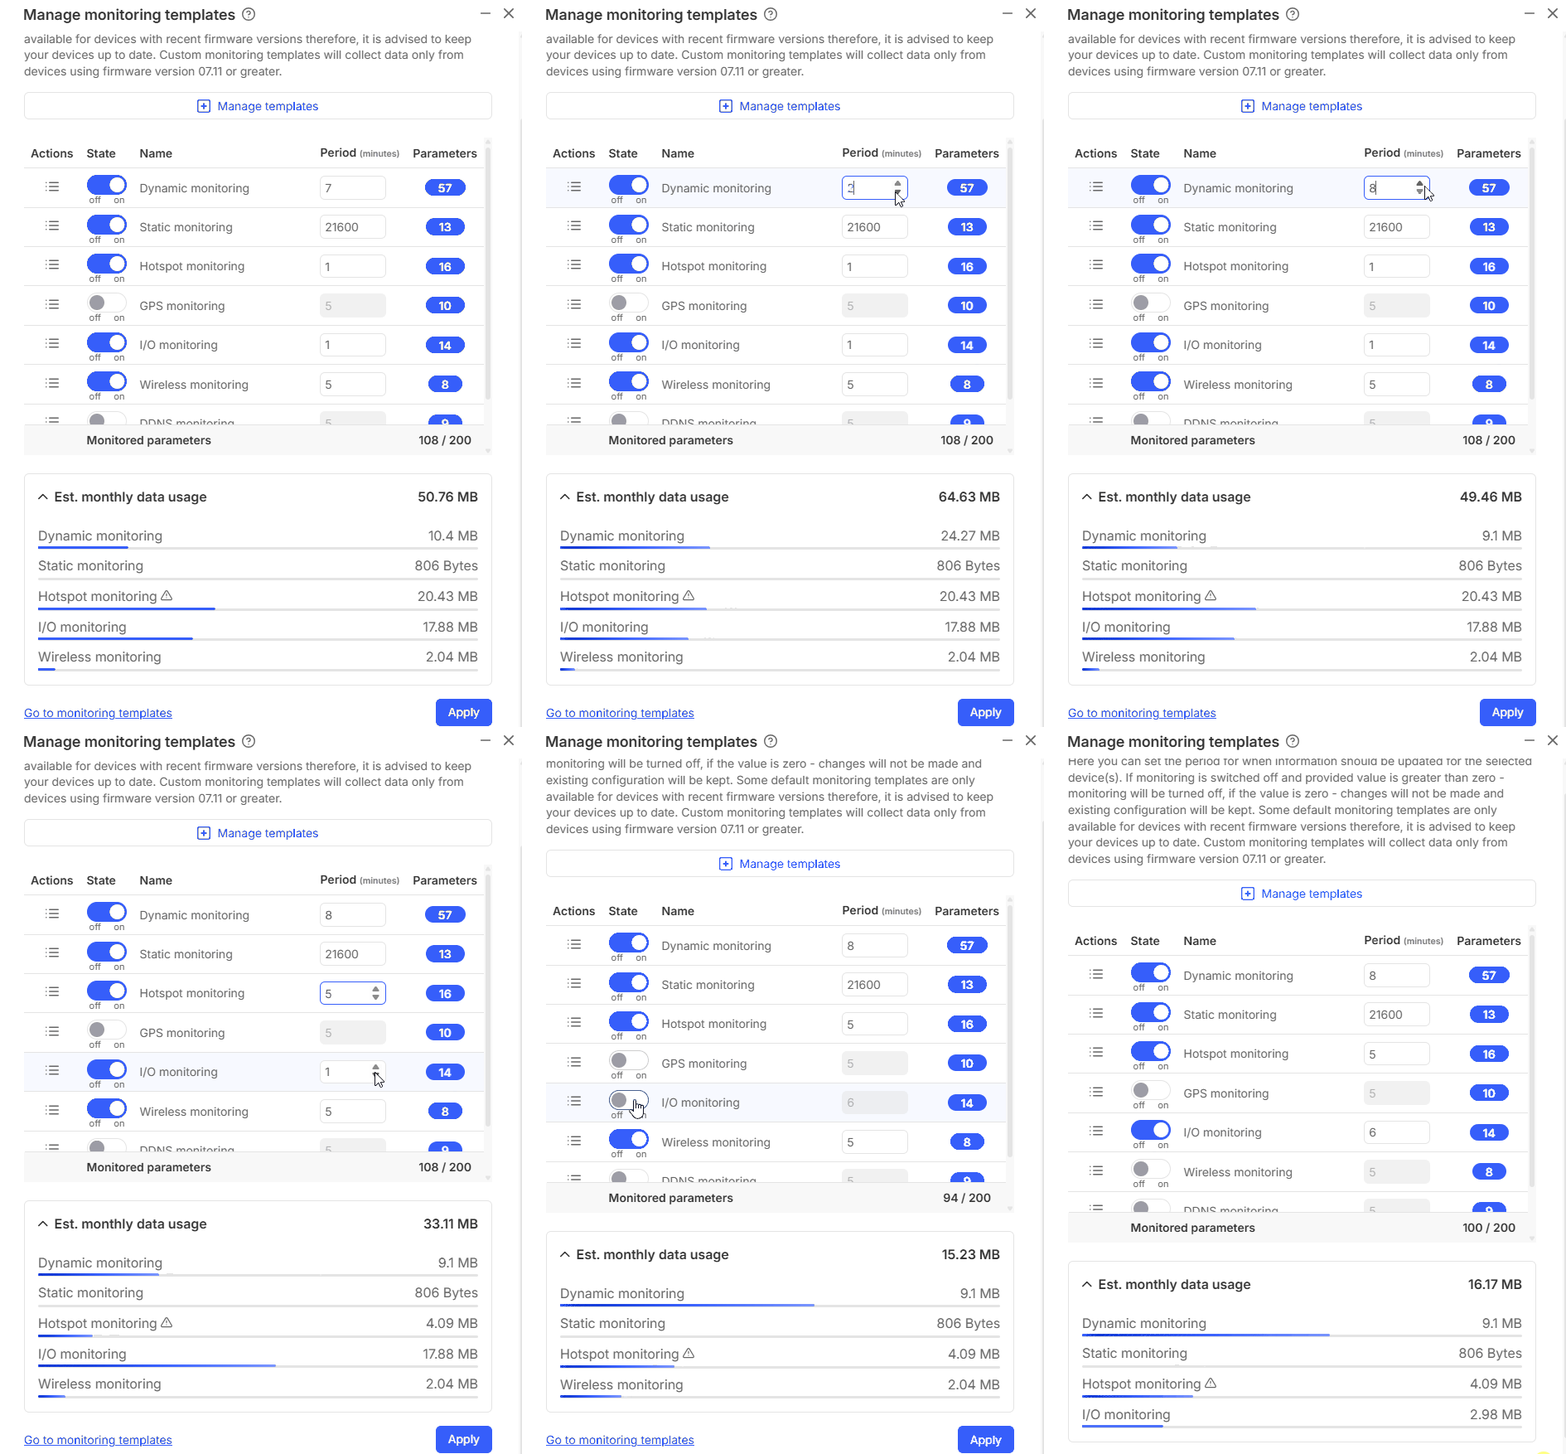
- After a new pop-up window should appear. Place check marks next to relevant parameters to set up custom monitoring intervals. On the right you can set up the monitoring update frequency; on the left, you can set the time units for that frequency. As you change these settings, an estimated monthly data usage value will be calculated below in real time:
- Dynamic Monitoring - every varying router parameter (e.g., uptime, mobile uptime, modem temperature, etc.).
- Static Monitoring - every static router parameter (e.g., product code, batch number, hardware revision, etc.).
- Hotspot Monitoring - Hotspot related parameters (Hotspot SSID, Hotspot IP address, Users online).
- GPS Monitoring - GPS related parameters (e.g., longitude, latitude, altitude, GPS fix status, time, etc.).
- Input/Output Monitoring - Input/Output related parameters (states of inputs and outputs).
Estimated monthly data usage
Estimated data usage calculates an estimate of monthly data usage based on the update period values specified above.


