Template:RMS Monitoring Dashboards
Dashboards
Dashboards allow you to visualize collected monitoring data in an easy-to-read and visually appealing format.
Overview
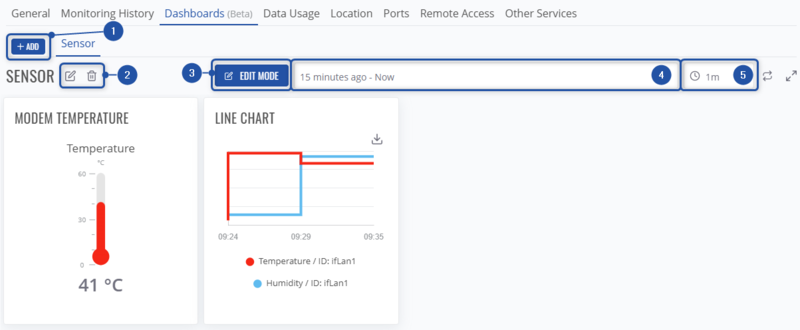
- Add a new dashboard template.
- Modify currently selected template's name or remove the template completely.
- Enable edit mode. Here, you'll be able to add new graphs, tables, gauges, etc., modify them, remove them from dashboards template.
- Select the time frame for which the data will be displayed.
- Select the frequency when the dashboard data will refreshed (Note: this only affects the visualization of data and not the frequency of data being collected from device).
Edit mode
Here, in Edit mode, you will be able to modify your selected dashboard template.
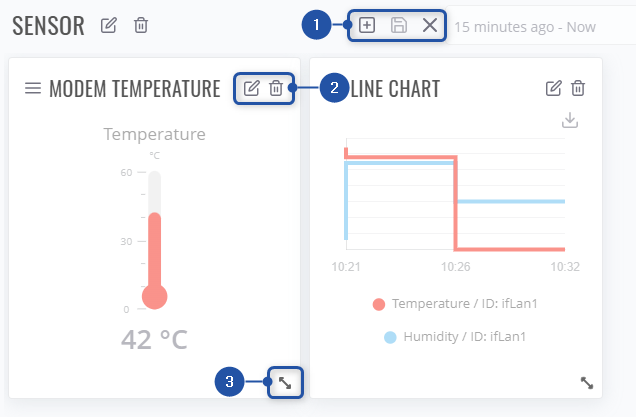
- Add new dashboard widgets to the template, save any changes or cancel them.
- Edit the selected dashboard or remove it from template.
- Adjust the size of dashboard widget.
Adding new dashboard widget
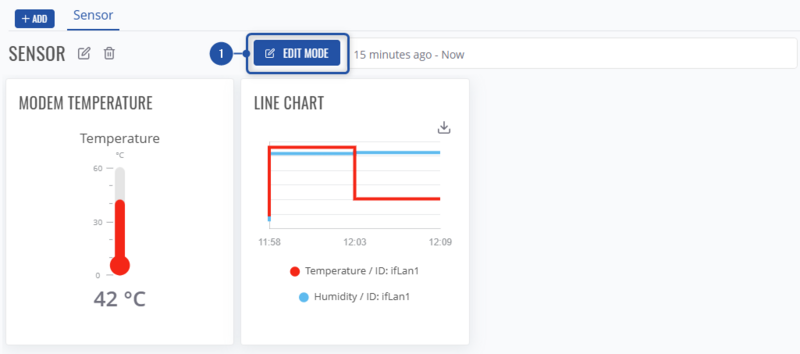
- First, enable dashboard template mode:
- Then, press on "+" icon.
- Choose widget group:
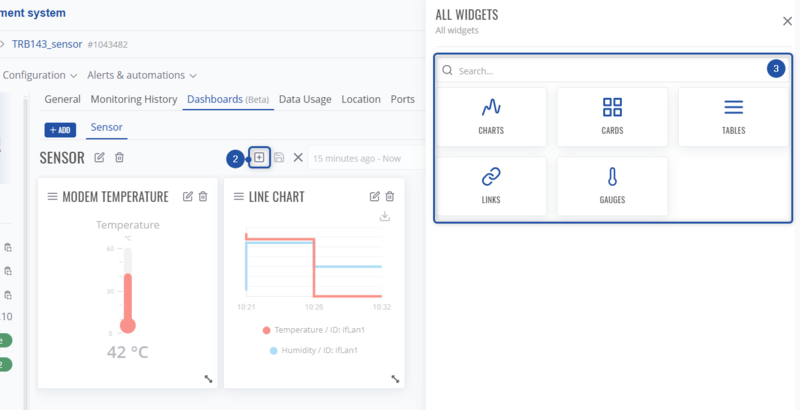
- Let's add a new line chart - choose "Charts" widget group.
- And select Line chart widget:

- Let's configure a chart for signal strength. Choose monitoring template in which the mobile signal paramater is being monitored. The default template which monitors it - Dynamic monitoring template. And specify the parameter which you'd like to visualise, in this case - Mobile signal.

Now, just configure the chart to your liking: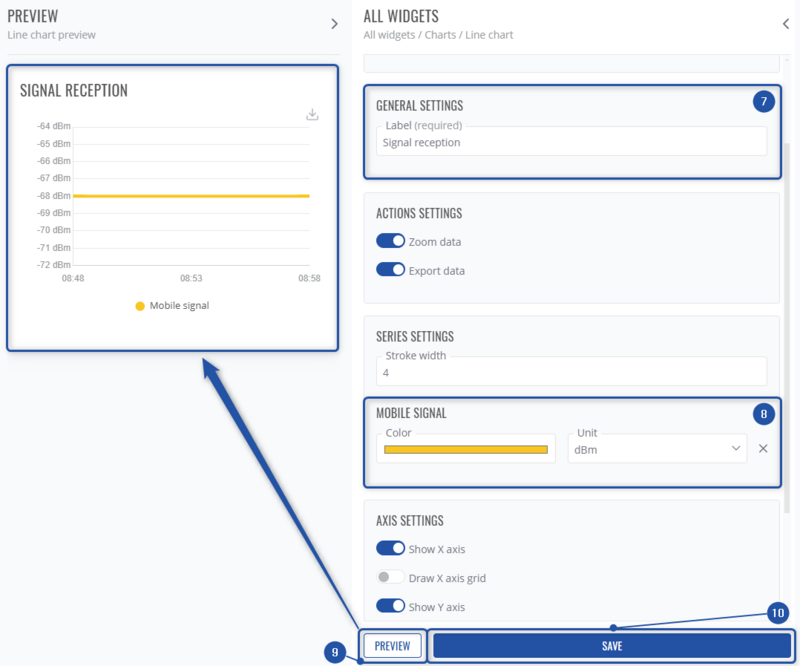
- Type in the chart name/label.
- Customize the color of chart line, change its units.
- View the preview of the chart while modifying it.
- Save the chart widget in order to add it into dashboard template.

