RMS UI changes: Difference between revisions
No edit summary |
TautvydasV (talk | contribs) m screenshot change |
||
| (5 intermediate revisions by 2 users not shown) | |||
| Line 1: | Line 1: | ||
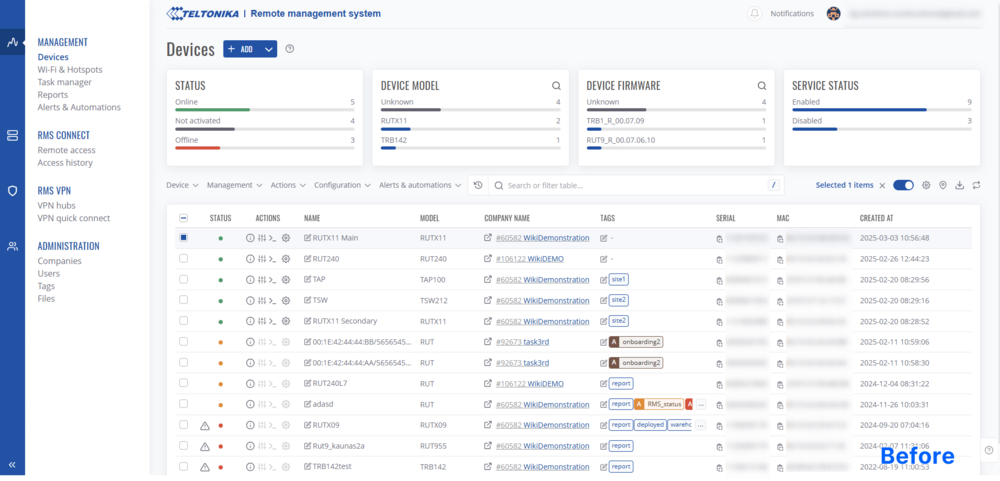
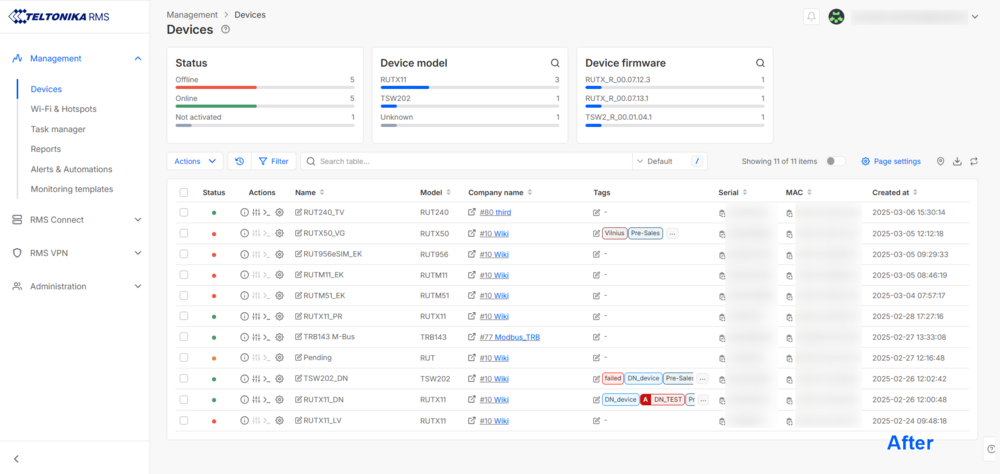
RMS website | In the upcoming major update, RMS website will receive the following UI changes and feature additions. | ||
<h2><span style="color:#0455a4">'''Updated'''</span> Design overhaul</h2> | <h2><span style="color:#0455a4">'''Updated'''</span> Design overhaul</h2> | ||
[[File:Rms design old.png|border|class=tlt-border|1000px]] | [[File:Rms design old.png|border|class=tlt-border|1000px]] | ||
[[File:Rms design | [[File:Rms design new_v2.png|border|class=tlt-border|1000px]] | ||
<h2><span style="color:#0455a4">'''Updated'''</span> Actions menu</h2> | <h2><span style="color:#0455a4">'''Updated'''</span> Actions menu</h2> | ||
The previous action menu and page-specific action buttons near the title have been updated for a consistent user experience. Now, all actions are combined into a single <span style="color:#365EFA>'''Actions'''</span> button. | The previous action menu and page-specific action buttons near the title have been updated for a consistent user experience. Now, all actions are combined into a single <span style="color:#365EFA>'''Actions'''</span> button. | ||
| Line 76: | Line 76: | ||
==<span style="color:#008000">'''New'''</span> Dashboards== | ==<span style="color:#008000">'''New'''</span> Dashboards== | ||
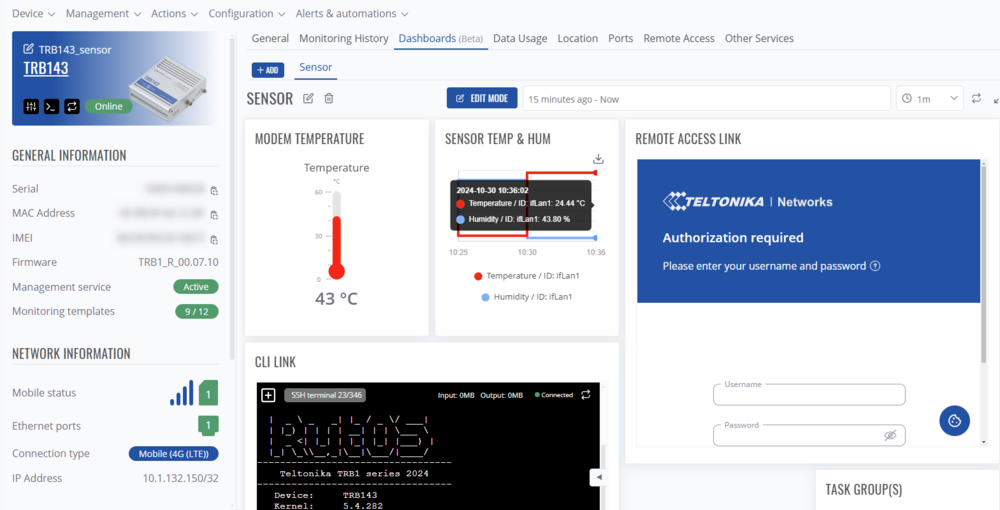
A new functionality has been added. Dashboards will let you configure your own dashboard template with a wide selection of widgets in your [[RMS Device Details|device details]] page. | A new functionality has been added. Dashboards will let you configure your own dashboard template with a wide selection of widgets in your [[RMS Device Details|device details]] page. | ||
[[File:RMS dashboards new.png|border|class=tlt-border|1000px]] | [[File:RMS dashboards new.png|border|class=tlt-border|1000px]] | ||
| Line 83: | Line 81: | ||
==<span style="color:#008000">'''New'''</span> Monitoring templates== | ==<span style="color:#008000">'''New'''</span> Monitoring templates== | ||
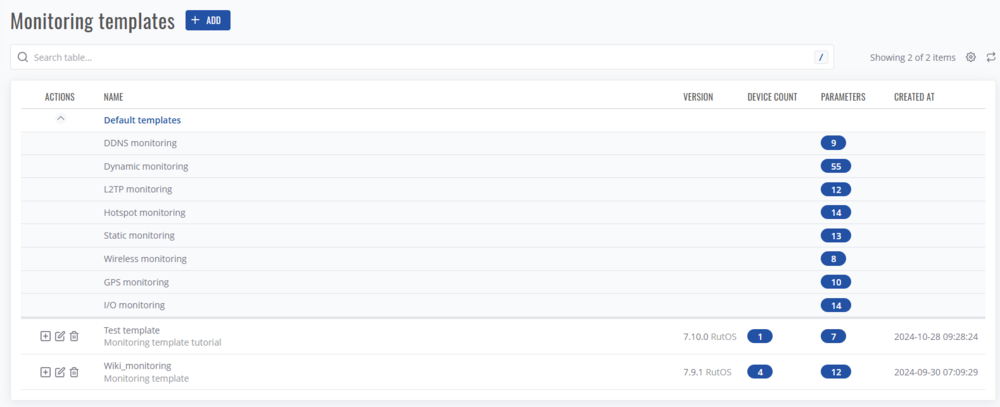
A new functionality of monitoring templates customization has been added. In this new page you can configure your own custom monitoring template and monitor parameters that were not available before. | A new functionality of monitoring templates customization has been added. In this new page you can configure your own custom monitoring template and monitor parameters that were not available before. | ||
[[File:RMS monitoring templates new.png|border|class=tlt-border|1000px]] | [[File:RMS monitoring templates new.png|border|class=tlt-border|1000px]] | ||
| Line 90: | Line 86: | ||
==<span style="color:#008000">'''New'''</span> Resources== | ==<span style="color:#008000">'''New'''</span> Resources== | ||
A new page under Administration has been added for more centralized RMS resource control and monitoring. Here, you will be able to see all resource pools that were assigned to your RMS company or any of your sub-companies, download each resource pool report to see how they were used, view created resource codes and how they were used, view company data conversion history. | A new page under Administration has been added for more centralized RMS resource control and monitoring. Here, you will be able to see all resource pools that were assigned to your RMS company or any of your sub-companies, download each resource pool report to see how they were used, view created resource codes and how they were used, view company data conversion history. | ||
[[File:Rms resource page.png|border|class=tlt-border]] | |||
==<span style="color:#FF0000">'''Removed'''</span> Metrics== | |||
[[RMS_Device_Details#Metrics|Metrics]] Metrics functionality that was previously used to visualize collected monitoring data has been removed. If you require your data to be visualized in chart form, please refer to the '''[[RMS_UI_changes#New Dashboards|Dashboards]]''' functionality. | |||
[[ | |||
[[Category: RMS]] | [[Category: RMS]] | ||
Revision as of 09:58, 7 March 2025
Main Page > IoT Platforms > RMS > RMS UI changesIn the upcoming major update, RMS website will receive the following UI changes and feature additions.
Updated Design overhaul
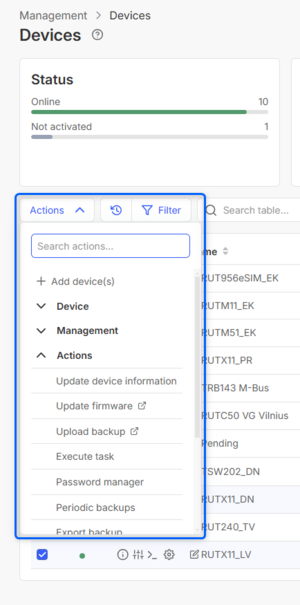
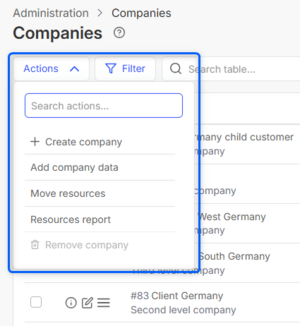
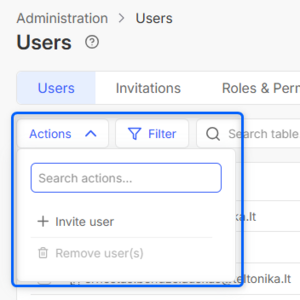
The previous action menu and page-specific action buttons near the title have been updated for a consistent user experience. Now, all actions are combined into a single Actions button.
| Before | After | |
|---|---|---|
| Devices page | 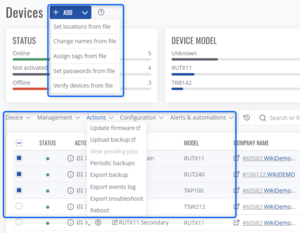 |
|
| Other pages | ||
| Companies page | 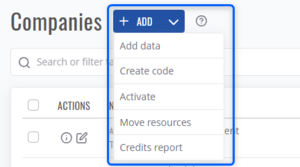 |
|
| Users page | 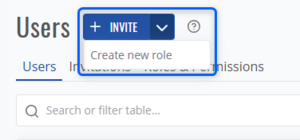 |
|
Updated Search functionality
Filter parameters are now accessed through a separate button just left of the search bar, while the option to search strictly by specific parameters is moved to the right.
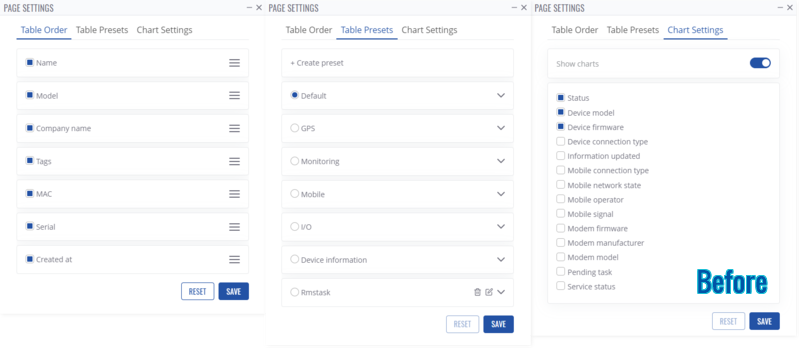
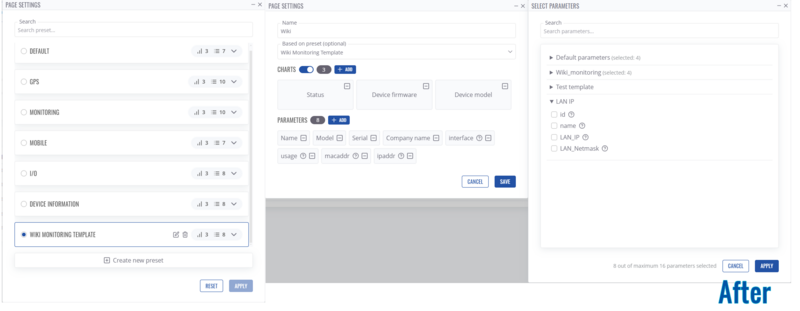
Updated Devices table customization
With the ability to monitor more parameters, device table and its presets have also received an improvement update: you can now include your monitored parameters from custom monitoring templates straight into the main device table.
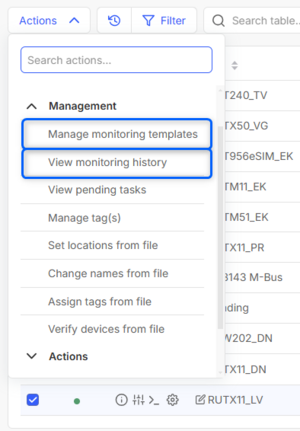
Updated Set monitoring update period to Manage monitoring templates and Monitoring History
Previously, to enable or disable additional monitoring parameters users had to go to "Set monitoring update period" in the top menu, this functionality is now known as "Manage monitoring templates". Similarly, "View Update history" has been renamed to "View Monitoring history" and features a new interface.
| Before | After | |
|---|---|---|
| Action menu | 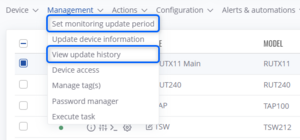 |
|
| Manage monitoring templates |  |

|
| View monitoring history |  |

|
| New | 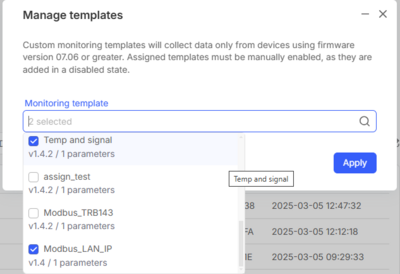
| |
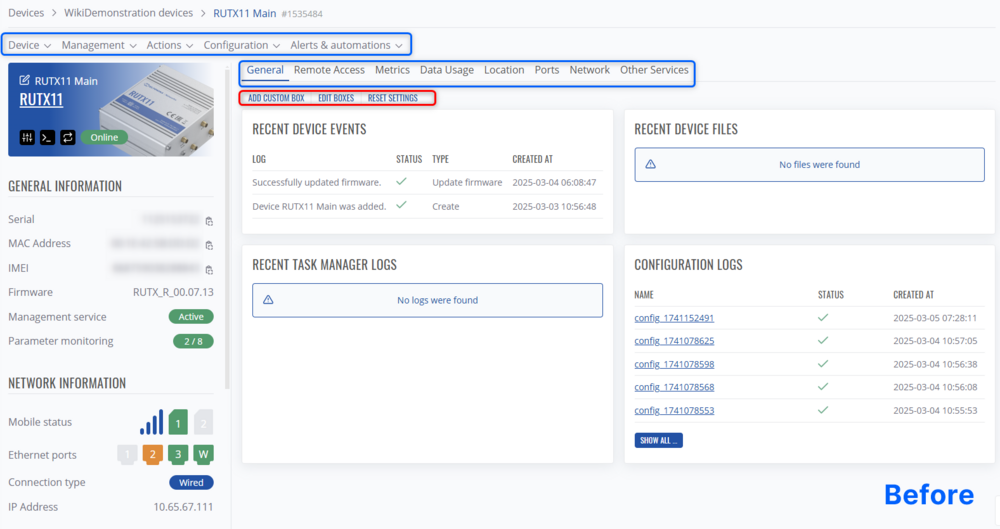
Updated Device details page layout and Removed Custom boxes
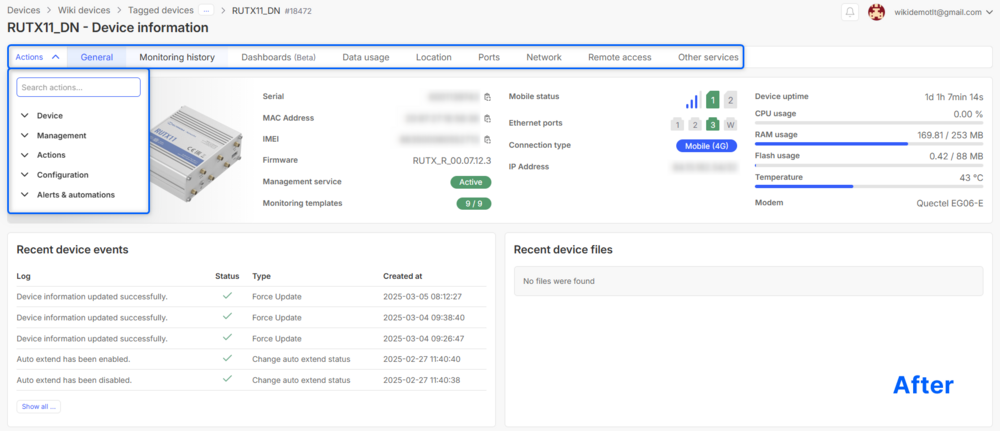
Device details status information was changed to a horizontal layout. All tabs and the action menu are placed in the same menu bar.
Custom boxes for displaying custom parameters in the Device Details menu were removed. Instead users are able to use the Dashboards functionality to display various parameters collected on RMS in customizable widgets.
New Dashboards
A new functionality has been added. Dashboards will let you configure your own dashboard template with a wide selection of widgets in your device details page.
New Monitoring templates
A new functionality of monitoring templates customization has been added. In this new page you can configure your own custom monitoring template and monitor parameters that were not available before.
New Resources
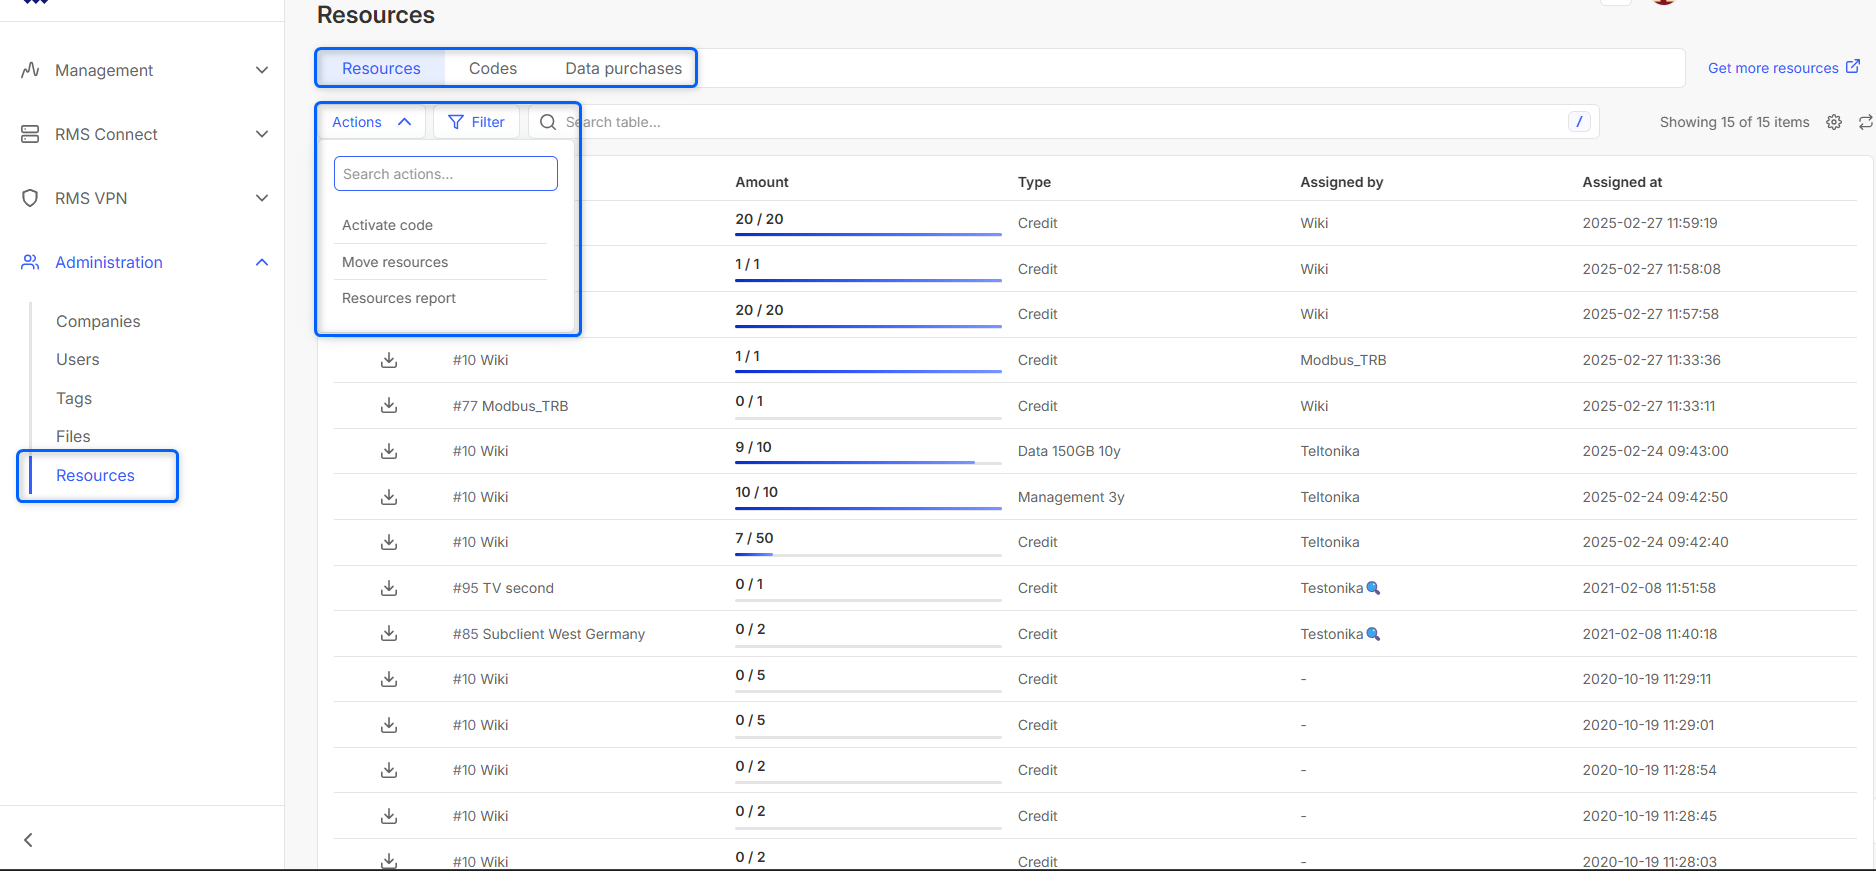
A new page under Administration has been added for more centralized RMS resource control and monitoring. Here, you will be able to see all resource pools that were assigned to your RMS company or any of your sub-companies, download each resource pool report to see how they were used, view created resource codes and how they were used, view company data conversion history.
Removed Metrics
Metrics Metrics functionality that was previously used to visualize collected monitoring data has been removed. If you require your data to be visualized in chart form, please refer to the Dashboards functionality.

