RMS Devices: Difference between revisions
(Created page with "__TOC__ ==Summary== The '''Overview''' section located in the '''Management''' menu tab is the homepage of the RMS. The Overview page is mostly used...") |
No edit summary |
||
| Line 1: | Line 1: | ||
__TOC__ | __TOC__ | ||
==Top Control Menu== | |||
All Management section features and functionalities are accessible using the Top Control Menu. Below you will find in-depth information about each different menu.. | |||
* [[RMS Device menu|Device menu]] | |||
* [[RMS Monitoring menu|Monitoring menu]] | |||
* [[RMS Actions menu|Actions menu]] | |||
* [[RMS Configuration menu|Configuration menu]] | |||
* [[RMS Alerts menu|Alerts menu]] | |||
* [[RMS Tags menu|Tags menu]] | |||
==Summary== | ==Summary== | ||
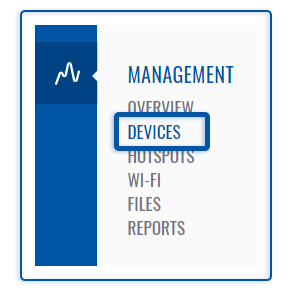
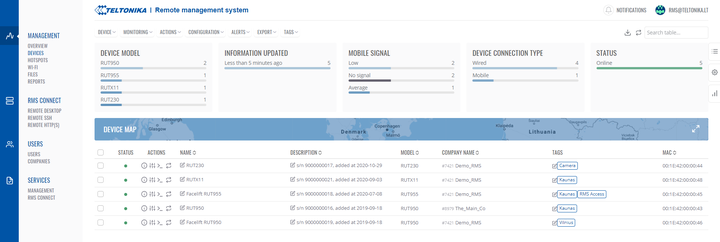
The Management section's primary function is to control, monitor, and configure all your Teltonika Networks devices. | |||
The | [[File:Rms manual left sidebar men devices v1.png]] [[File:Rms manual management devices full v1.png|720px]] | ||
==Right customization panel== | |||
The right customization panel allows filter and customize what kind of data you will see in the main content window. | |||
* In the '''Table filters''' tab, you can filter information by various skews for example: company, tag, status, pending task, and many more. | |||
* '''Table columns''' tab gives you many different options to choose specific columns you want to see in the main content window. | |||
* The tab for '''Chart settings''' provides you with options to select the different charts you want to be displayed. Or to disable the charts altogether. | |||
[[File:Rms interface guide right customization panel v1.mp4|720px]] | |||
<br> | |||
[[Category:RMS_Management]] | |||
Revision as of 15:31, 28 November 2022
Main Page > IoT Platforms > RMS > RMS Manual > RMS Management > RMS DevicesTop Control Menu
All Management section features and functionalities are accessible using the Top Control Menu. Below you will find in-depth information about each different menu..
Summary
The Management section's primary function is to control, monitor, and configure all your Teltonika Networks devices.
Right customization panel
The right customization panel allows filter and customize what kind of data you will see in the main content window.
- In the Table filters tab, you can filter information by various skews for example: company, tag, status, pending task, and many more.
- Table columns tab gives you many different options to choose specific columns you want to see in the main content window.
- The tab for Chart settings provides you with options to select the different charts you want to be displayed. Or to disable the charts altogether.


