RMS Device Details: Difference between revisions
TautvydasV (talk | contribs) updates for redesign 1 |
TautvydasV (talk | contribs) updates for redesign 2 |
||
| Line 1: | Line 1: | ||
==Summary== | ==Summary== | ||
Here you can see all the details and metrics of the device, various logs. Also, other features that were configured on RMS regarding the selected device will be shown here. | Here you can see all the details and metrics of the device, various logs. Also, other features that were configured on RMS regarding the selected device will be shown here. | ||
'''Note:''' you can get here by clicking on [[File:Rmsdevicedetails2.png|24px]] icon in the device list in the Actions column. | |||
[[File:RMS_devices_device_details_button_v1.png|border|class=tlt-border]] | [[File:RMS_devices_device_details_button_v1.png|border|class=tlt-border]] | ||
==Overview== | ==Overview== | ||
[[File:RMS device details main page v1.png|border|class=tlt-border]] | [[File:RMS device details main page v1.png|border|class=tlt-border]] | ||
Here you can see the UI of the Device details page: | Here you can see the UI of the Device details page: | ||
#On the left is the | #On the left is the main Actions button and following it are various tabs that provide specific information and metrics about the selected device. | ||
#Shows general | #Shows general device information. | ||
#Shows recent device events; such as when the device was added, changes to RMS monitoring services, and RMS resources for the device. | #Shows recent device events; such as when the device was added, changes to RMS monitoring services, and RMS resources for the device. | ||
#Shows various files that were recently exported from the device. | #Shows various files that were recently exported from the device. | ||
| Line 15: | Line 16: | ||
In this tab you check general information about the selected device. | In this tab you check general information about the selected device. | ||
[[File:RMS device details general information v1.png|border|class=tlt-border]] | [[File:RMS device details general information v1.png|border|class=tlt-border]] | ||
#Buttons to connect to the device's WebUI, CLI and force | #Buttons to connect to the device's WebUI, CLI and force a device information update. | ||
#General information - serial number, MAC, IMEI, firmware, monitoring status, and the number of parameters being monitored. | #General information - serial number, MAC, IMEI, firmware, monitoring status, and the number of parameters being monitored. | ||
#Network information - mobile status, used SIM slot, ethernet port status, WAN connection type, WAN IP address. | #Network information - mobile status, used SIM slot, ethernet port status, WAN connection type, WAN IP address. | ||
| Line 21: | Line 22: | ||
Below you can find various logs about the device: | Below you can find various logs about the device: | ||
[[File:RMS device details general information lower v1.png|border|class=tlt-border]] | |||
Revision as of 15:31, 3 March 2025
Main Page > IoT Platforms > RMS > RMS Manual > RMS Management > RMS Devices > RMS Device DetailsSummary
Here you can see all the details and metrics of the device, various logs. Also, other features that were configured on RMS regarding the selected device will be shown here.
Note: you can get here by clicking on ![]() icon in the device list in the Actions column.
icon in the device list in the Actions column.

Overview
 Here you can see the UI of the Device details page:
- On the left is the main Actions button and following it are various tabs that provide specific information and metrics about the selected device.
- Shows general device information.
- Shows recent device events; such as when the device was added, changes to RMS monitoring services, and RMS resources for the device.
- Shows various files that were recently exported from the device.
- Shows the logs of recently executed tasks via RMS Task Manager.
- Shows the logs of recent device configuration changes and other device network events.
General
In this tab you check general information about the selected device.

- Buttons to connect to the device's WebUI, CLI and force a device information update.
- General information - serial number, MAC, IMEI, firmware, monitoring status, and the number of parameters being monitored.
- Network information - mobile status, used SIM slot, ethernet port status, WAN connection type, WAN IP address.
- Device information - device uptime, CPU, RAM, Flash usage, current temperature and modem model.
Below you can find various logs about the device:

Additionally, you can customize this tab to your own preferences.
- Add Custom Box - lets you create a custom info box with your desired parameters
- Edit Boxes - lets you change the order of the default boxes and configure your created custom boxes.
- Reset Settings - resets the order to default, and removes custom boxes.
Add Custom Box
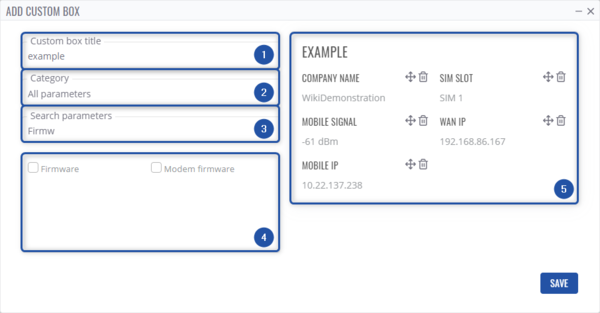
Clicking on this option will open a new pop-up window that lets you create a new info box with your desired parameters.

- Type a title for your new info box.
- Lets you sort parameters by category.
- Lets you search parameters by name.
- In this section parameters will be displayed.
- Lets you edit how your new info box will be displayed, change the order or remove completely selected parameters.
Edit boxes
Clicking on this will let you edit the view and order of the boxes in the General tab.
The button will change to Cancel Editing, while all the default boxes will now have a drag button which lets you change the order of display, while your custom boxes in addition to the drag button, will also have configure and remove box buttons.

Metrics
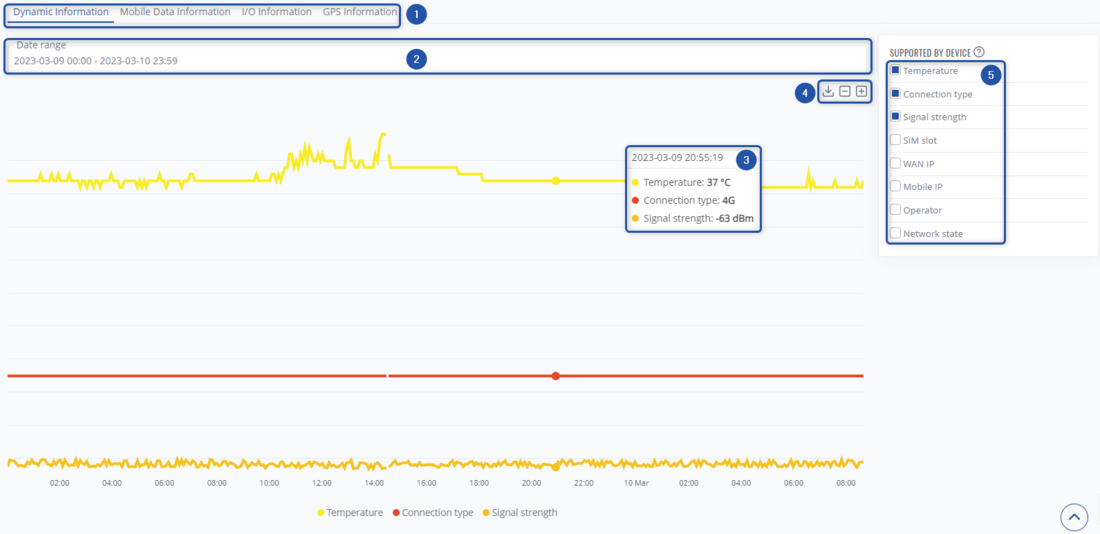
Here, you'll see various metrics displayed on the graphs.
- You can choose between different categories of metrics to view - Dynamic Information, Mobile Data Information, I/O Information, and GPS Information.
- Choose the data range for the graph.
- Here, you'll see the value of parameters on the timeframe in the graph by hovering.
- Here, you'll be able to download graph, zoom in/out.
- In this section, you can select which parameters will be displayed.
- Note: even if your device has ability to collect data on specific parameter, it may not, until you enable it in Management -> Set monitoring period.
Monitoring History
Here, you'll be able to view the data collected by your enabled monitoring templates over a chosen time period.
To view a desired monitoring template's data:
- Select a date range.
- Select a template to get a list of monitored parameters.
Once the template is selected, you can then choose to view By template or By parameter. In By template view, you will see all parameter section's values at the selected timestamp. While in By parameter view, you will see a specific parameter's values over a selected date range
View by template
Instructions
- Select By template.
- Select the timestamp to view monitored parameter values at that time.
- Select a monitored parameter section/group.
- On the right side you will see parameter values at the selected time.
View by parameter
Instructions
- Select By parameter.
- Select a monitored parameter section/group.
- Select specific parameter.
- On the right side you will see selected parameter's values during the selected date range.
Dashboards
Dashboards allow you to visualize collected monitoring data in an easy-to-read and visually appealing format.
Overview
- Create a new dashboard template.
- Filter your created dashboards.
- Search for a dashboard using.
- View the actual dashboard.
- By pressing the edit button you can quickly view which widgets the dashboard is using, change its name, auto refresh interval.
Viewing a dashboard
After selecting a dashboard, you'll be able to view data from various widgets, create new widgets, and modify existing ones.

- Save or cancel recent changes to the dashboard.
- Add a widget to the dashboard.
- Drag the widget, edit the widget, and remove it from the dashboard.
- Select the timeframe from which the dashboard will display all of the gathered data.
- Perform a quick dashboard data refresh.
Adding new dashboard widget
- Press the + Add widget button
- Select a group of widgets
- Select a specific type of widget
- Depending on the selected widget you will see various parameters for the widget.
- After you are done customizing the widget, press the Save button.
New widget example
Let's create a widget to monitor mobile parameters (RSRP, RSRQ, SINR, and mobile signal).
- Press the + Add widget button
- Select Charts and Line chart
- Select Dynamic monitoring as Monitoring template
- Select your desired parameters. In this case, we need RSRP, RSRQ, SINR, and mobile signal.
- Press Save to create the widget and add it to your dashboard.
- You can do some visual changes to the widget. For example, you can set custom colors, line chart's stroke width, or select measurement units for each parameter.
 Note: when making changes to the widget, you can press the Preview button to quickly view changes without actually saving them.


