RUT850 Graphs
Summary
The real-time Graphs page displays various statistical data changes over time in the form of graphs.
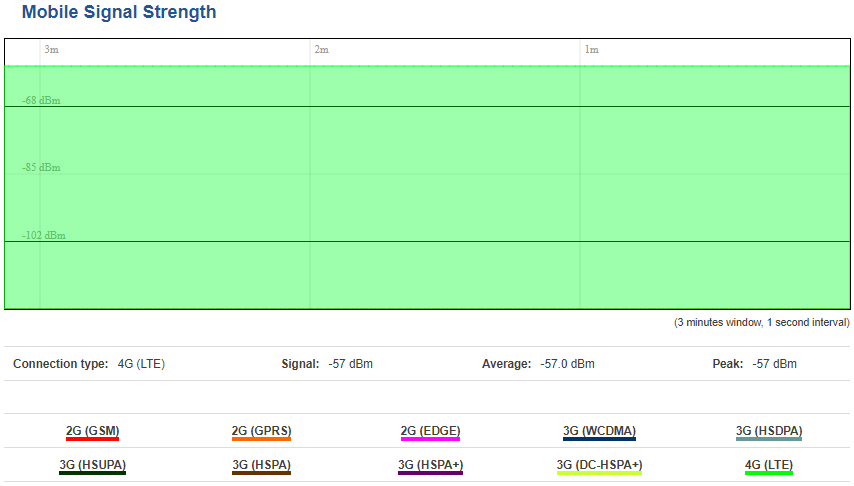
Mobile Signal Strength
The Mobile Signal Strength graph displays mobile signal strength (RSSI, measured in dBm) value changes over a period of 3 minutes.
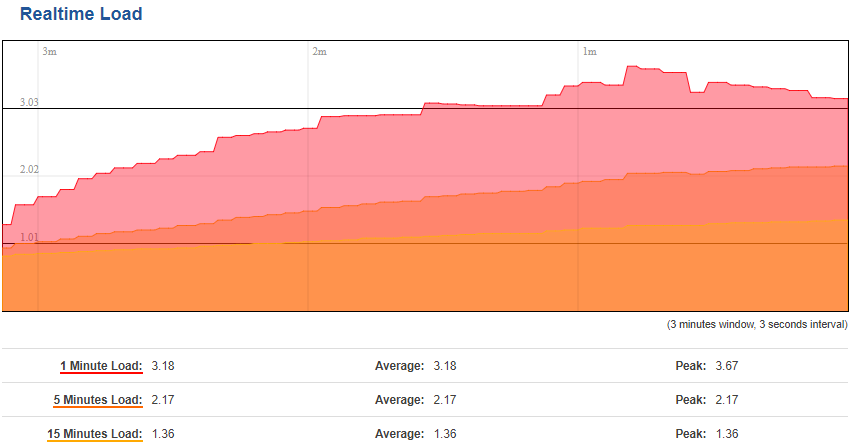
Realtime Load
The Realtime Load section displays a tri-graph that illustrates average CPU load values in real time. The graph consists out of three color coded graphs, each one corresponding to the average CPU load over 1 (red), 5 (orange) and 15 (yellow) most recent minutes.
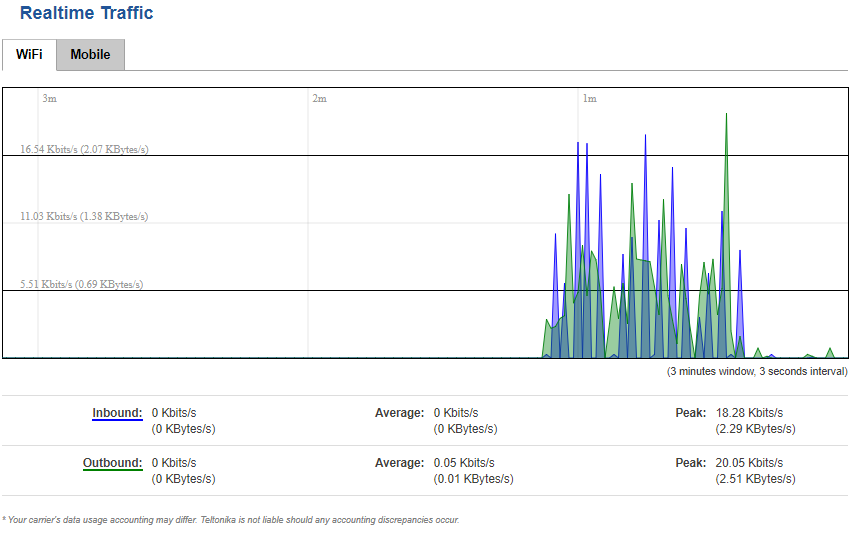
Traffic
The Realtime Traffic window lets you monitor average inbound and outbound traffic over the course of 3 minutes; each new measurement is taken every 3 seconds. The graphs consist out of two color coded graphs: the green graph shows the outbound traffic, the blue graph shows the inbound traffic. Although not graphed, the page also displays peak loads and averages of inbound and outbound traffic.
| Graph | Description |
|---|---|
| Wi-Fi | Shows the amount of data that has been sent and received through the wireless radio |
| Mobile | Shows the amount of data that has been sent and received through the Mobile interface |
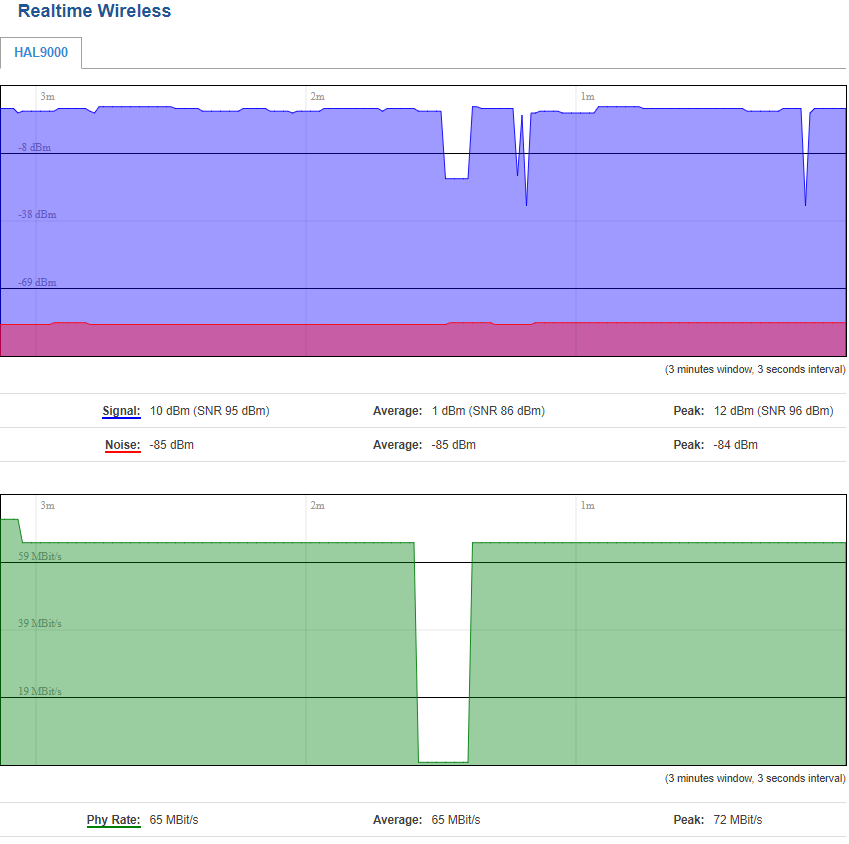
Wireless
The Realtime Wireless graph displays the wireless radio signal strength, signal noise, average and peak signal levels and the theoretical maximum channel permeability.
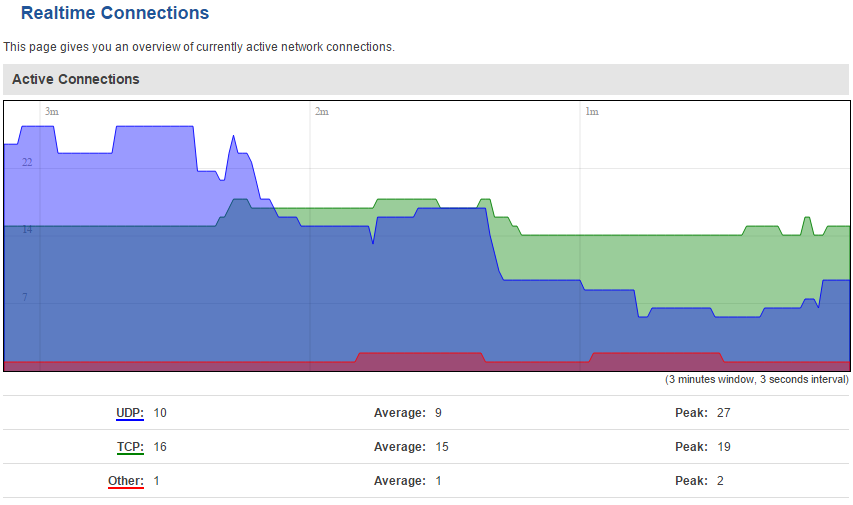
Realtime Connections
The Realtime Connections graph displays currently active network connections with the information about network, protocol, source and destination addresses and transfer speed.

