RMS Device Details
Summary
Here you can see all the details and metrics of the device, various logs and other features that were configured on RMS regarding the selected device will also be shown here.
You can get here by clicking on ![]() icon in the device list in the Actions column.
icon in the device list in the Actions column.
![]()
Overview
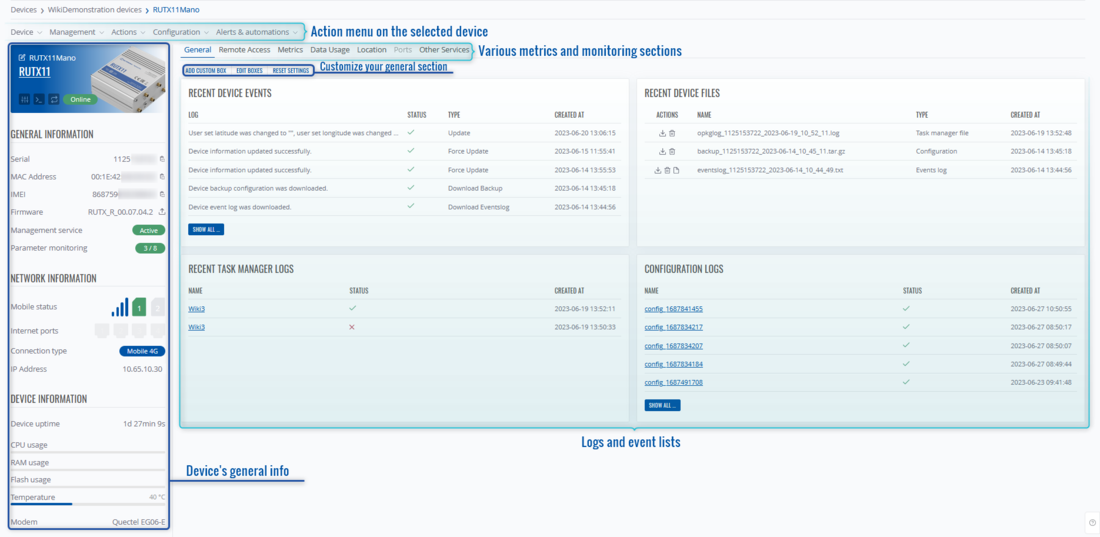
Here you see the UI of the Device details:
- On the left side, general device information will be listed, left to the device picture there are actions to connect to WebUI, CLI and force update device information.
- Above the general device info you can see an action menu on this specific device, it's the same menu as on the Devices page when any device is selected.
- Below action menu you can select various section which will display metrics, details according to the selected section.
- In the middle you will see logs, event lists, metrics, location and other services by the selected section above.
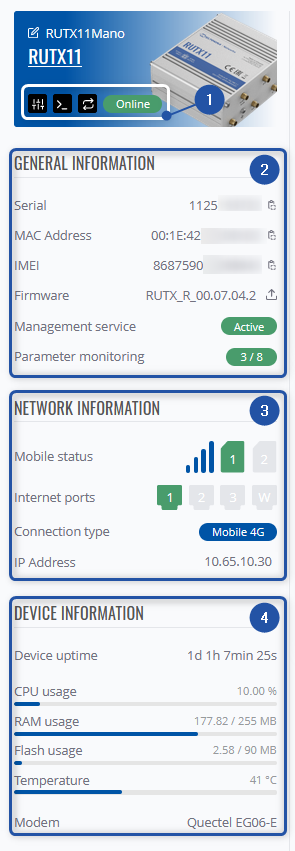
- Information about the selected product, and its connection status. You can also change its name, and description, or connect to its WebUI, CLI.
- Current system usage, serial number, current firmware version, temperature.
- Ethernet ports status - their current usage, speed, duplex type.
- Mobile status - current SIM status, signal strength, operator, and data usage.
- Periodic backups - their frequency, enabled/disabled status, and periodic backup files.
General
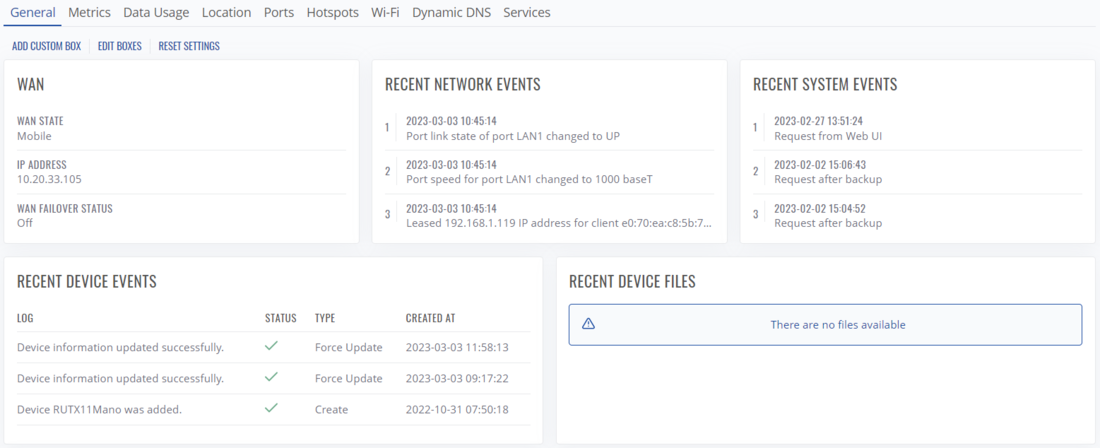
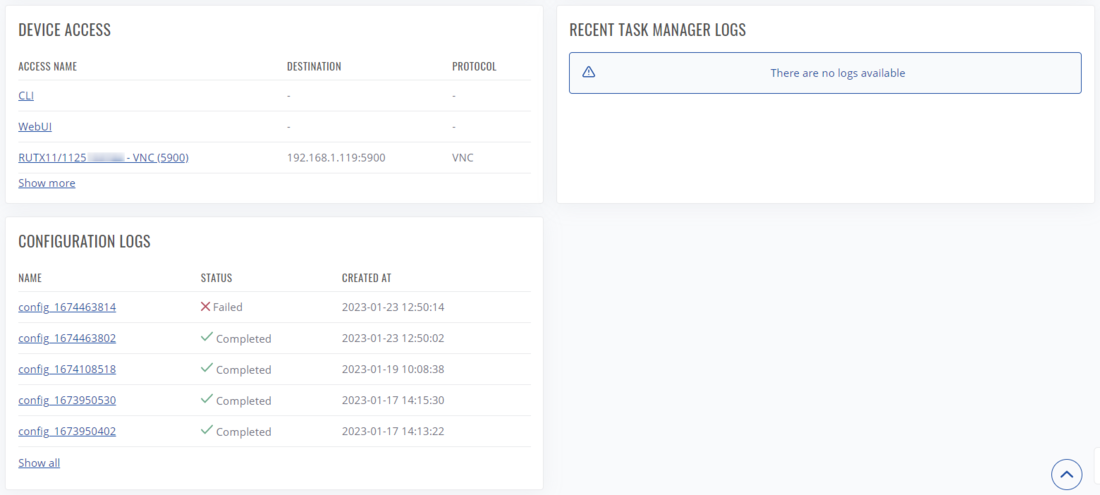
In this tab you check other general information about this device:
- WAN status
- Most recent network, system or device events,
- Most recent device files or logs
- Configured Device Access connection list.
Additionally, you can customize this tab to your own preferences.
- Add Custom Box - lets you create a custom info box with your desired parameters
- Edit Boxes - lets you change the order of the default boxes and configure your created custom boxes.
- Reset Settings - resets the order to default, and removes custom boxes.
Add Custom Box
Clicking on this option will open a new pop-up window that lets you create a new info box with your desired parameters.
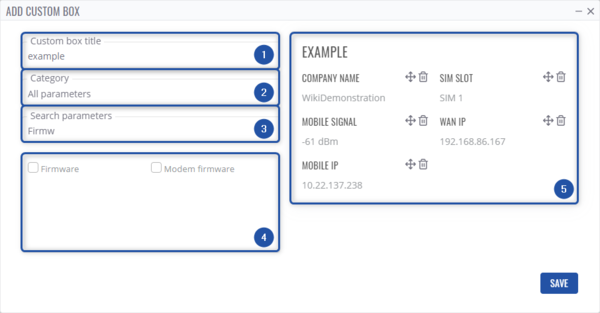
- Type a title for your new info box.
- Lets you sort parameters by category.
- Lets you search parameters by name.
- In this section parameters will be displayed.
- Lets you edit how your new info box will be displayed, change the order or remove completely selected parameters.
Edit boxes
Clicking on this will let you edit the view and order of the boxes in the General tab.
The button will change to Cancel Editing, while all the default boxes will now have a drag button which lets you change the order of display, while your custom boxes in addition to the drag button, will also have configure and remove box buttons.

Metrics
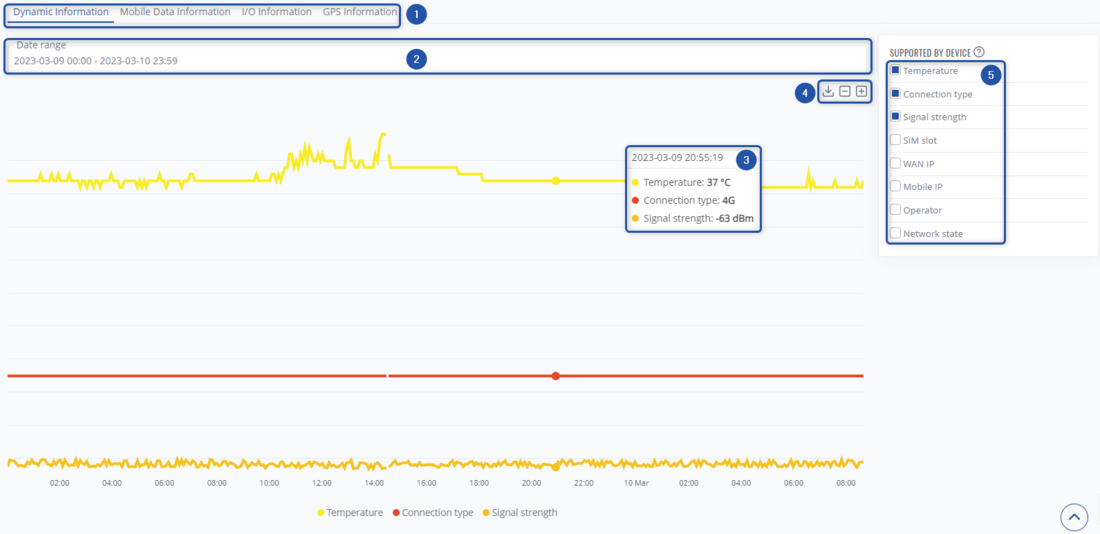
Here, you'll see various metrics displayed on the graphs.
- You can choose between different categories of metrics to view - Dynamic Information, Mobile Data Information, I/O Information, and GPS Information.
- Choose the data range for the graph.
- Here, you'll see the value of parameters on the timeframe in the graph by hovering.
- Here, you'll be able to download graph, zoom in/out.
- In this section, you can select which parameters will be displayed.
- Note: even if your device has ability to collect data on specific parameter, it may not, until you enable it in Management -> Set monitoring period.

