Template:Da3vid configuration example
The name da³vid stands for datapoint acquisition analysis and visualisation and is developed by "embedded data GmbH" in Germany.
da³vid is a cloud and/or edge based, real-time IoT management software.
More information can be found here - https://www.embedded-data.de/produkt_david
Introduction
This article contains instructions on how to do a basic setup and configuration with a Teltonika device in order to connect to da³vid.
Prerequisites
You will need:
- A Teltonika device (RUT or TRB) with MODBUS support and internet connection
- A Embedded data GmbH da³vid software and license
Configuring the device
If you're having trouble finding this page or some of the parameters described here on your device's WebUI, you should turn on "Advanced WebUI" mode. You can do that by clicking the "Advanced" button, located at the top of the WebUI.
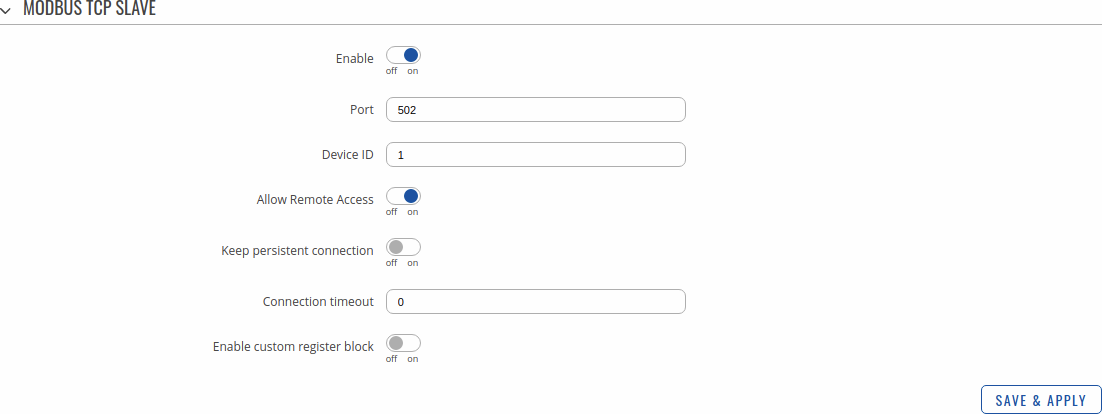
Before you connect the device to da³vid, you must first enable MODBUS by following these steps:
- Log into the device's WebUI.
- Navigate to Services → MODBUS.
- Enable the service and Allow Remote Access option.
- Press Save & Apply
You may also change the Port and Device ID, but for this example we will be using the default values.
Configuring da³vid
Once logged into the portal, first add a new station.
Adding a new station
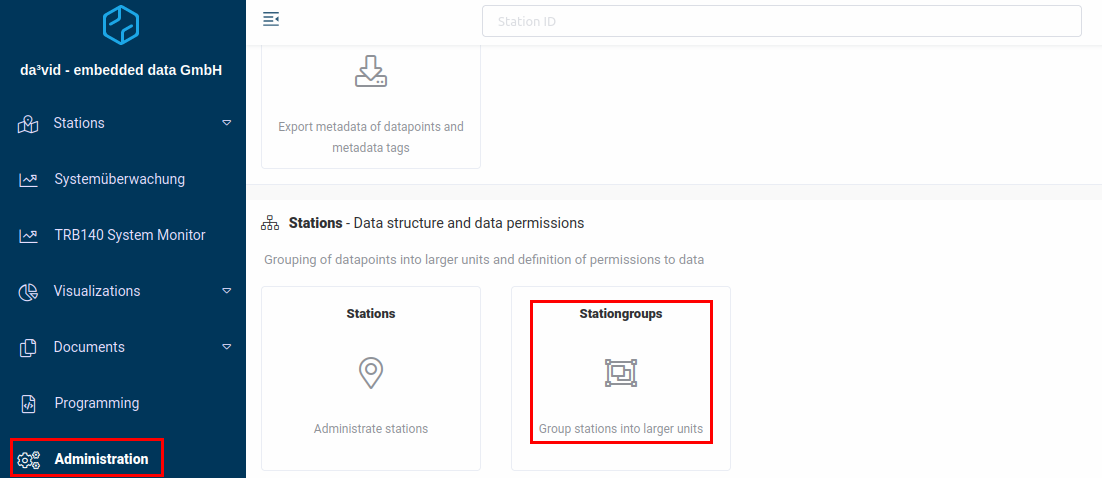
Before you start configuring the device, you must create a Station Group:
- Navigate to Administration on the side-menu.
- Find Stationgroups in the list.
- Press Add new root group.
- Enter the name of your group.
- Save the group.
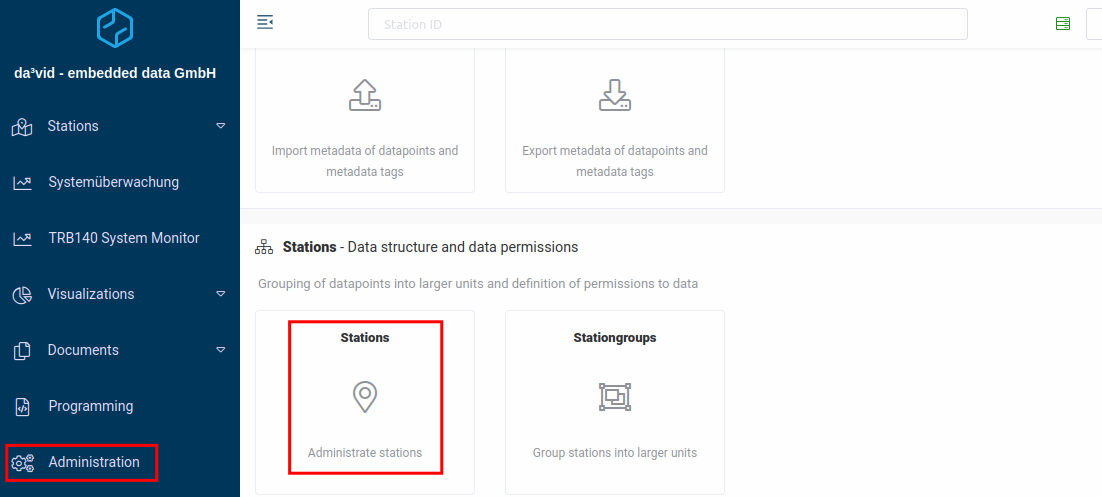
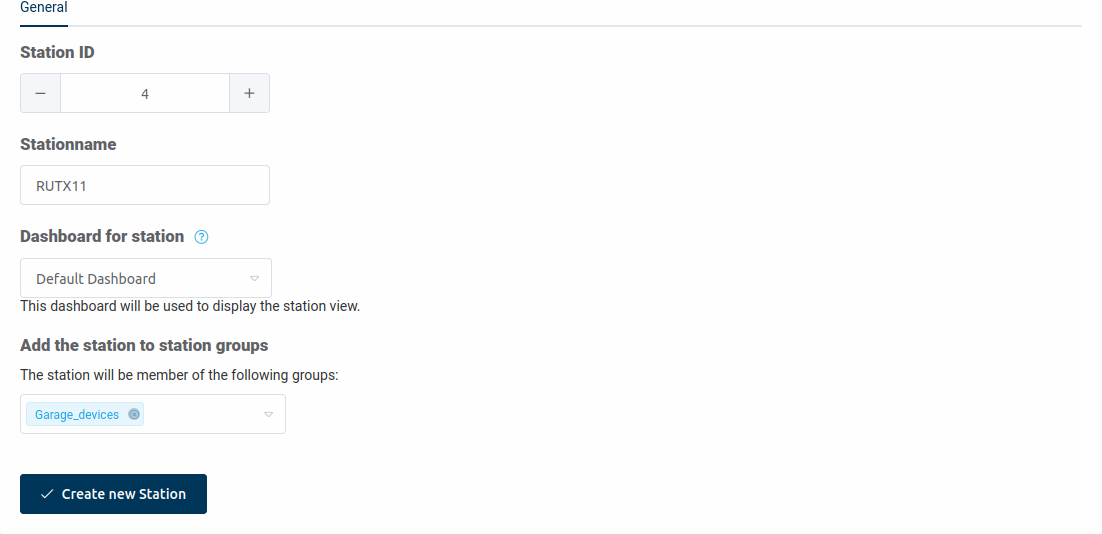
Then you can add the station.
- Navigate to Administration on the side-menu.
- Find Stations in the list.
- Enter the Station name of your device. Used for management purposes only.
- Select Default Dashboard for now, you can change it later.
- Select the previously created Station group.
- Press Create new Station.
Adding a MODBUS device
Once a station has been created, we need to add a new MODBUS device for that station.
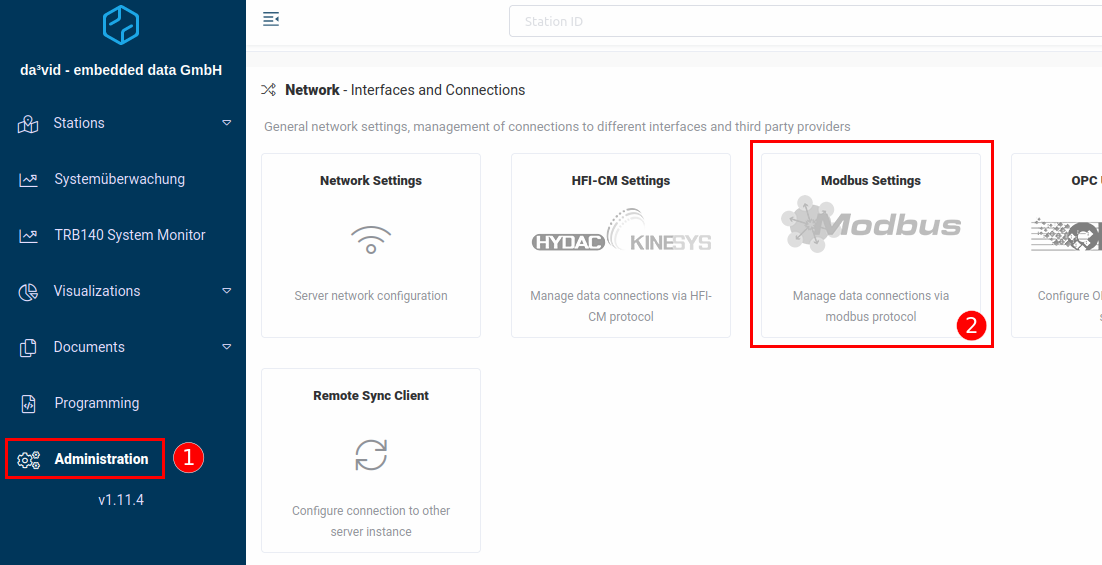
- Navigate to Administration on the side-menu.
- Find Modbus Settings in the list below.
- Press New Connection.
- In this example we will be configuring using TCP/IP.
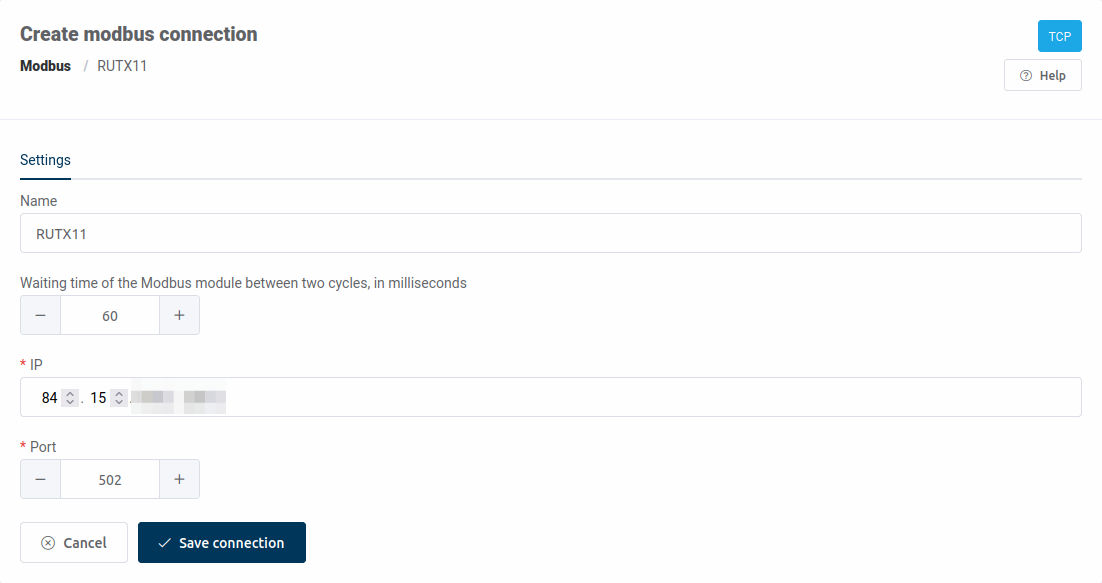
A device configuration window should appear. Here you should enter your device's details
- Enter the name of your device. Used for management purposes only.
- Enter the WAN IP of your device.
- Enter the Port of Modbus slave.
- Press Save Connection.
After saving the new configuration, don't forget to Enable it.
Next, you need to add our MODBUS Slave.
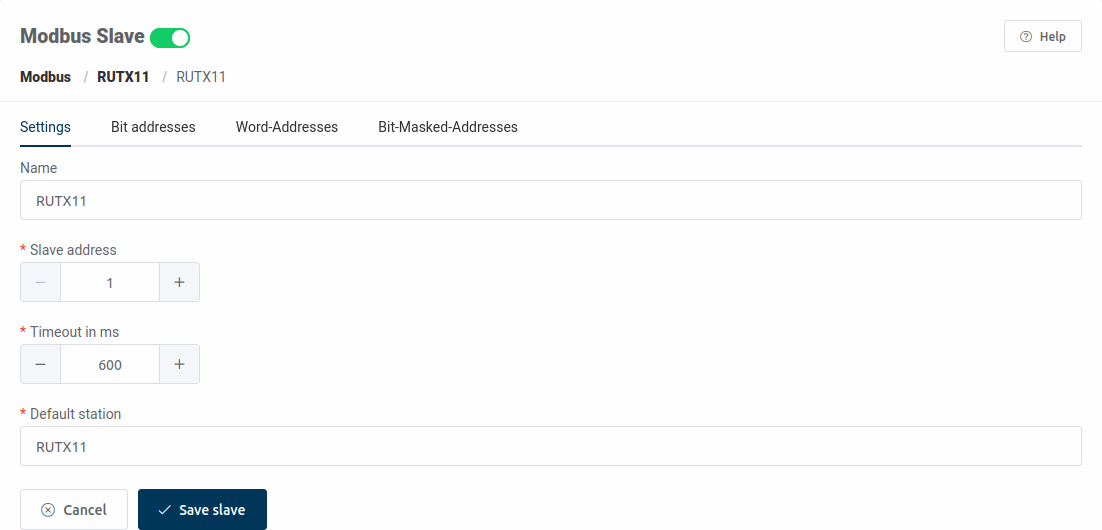
A slave configuration window should appear. Enter your slave's details:
- Enter the name of your slave. Used for management purposes only.
- Enter the Slave address of your device which is identical to Device ID in MODBUS settings on WebUI.
- Adjust the timeout to your needs.
- Choose your device's station.
- Press Save Connection.
- Lastly enable the slave with the toggle above configuration.
The device should be connected to da³vid. To do a simple check, you can try to pull some data from the device following the steps below.
Configuring information output
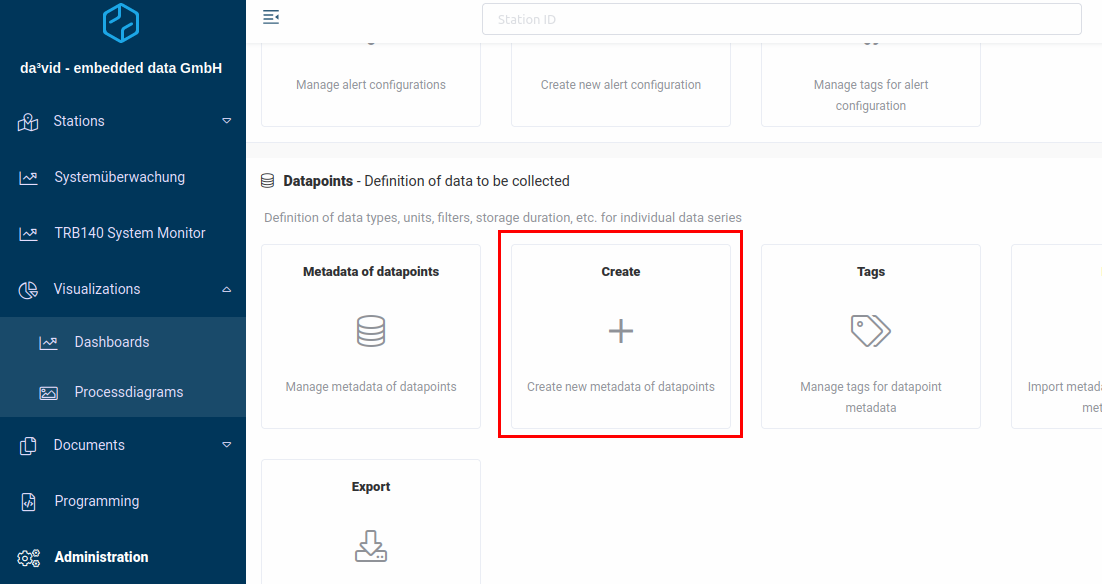
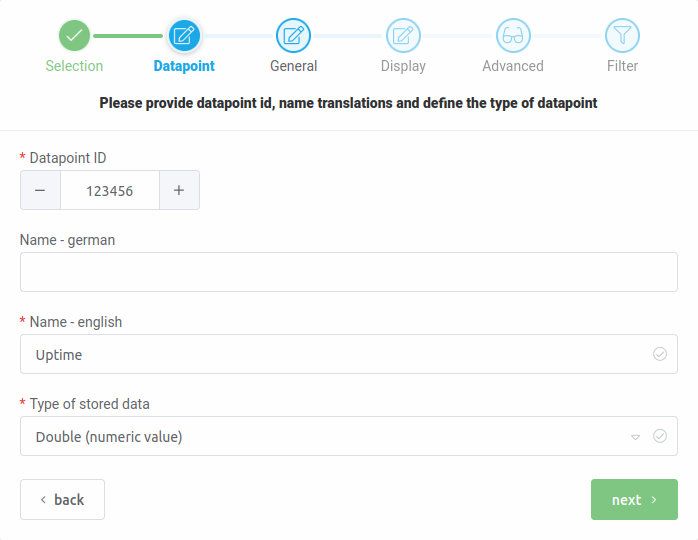
For this example, we are going to retrieve System uptime from our device. First, we need to create a new datapoint:
- In the Administration page, find Datapoints section and press on Create.
A new window should appear for creating a datapoint:
- Select Create metadata for single datapoint.
- Configure the data point:
- Enter Datapoint ID, used for management purposes
- Enter the name, used for management purposes
- Select Double data type.
You can leave the rest of the configuration default.
Once the datapoint is created, we can add it to our Modbus Slave:
- Navigate to Administration → Modbus settings → Edit your device → Slaves → Word-Addresses.
- Press New Address.
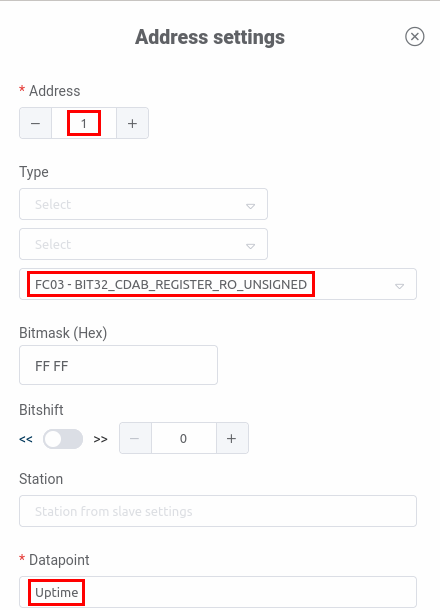
- A new side menu should appear for configuring the address:
- Enter the Modbus address of System uptime, on Teltonika devices it is 1.
- Select the data type. Uptime address is represented by 32 bit unsigned int, so select FC03 - BIT32_CDAB_REGISTER_RO_UNSIGNED.
- Select your previously created datapoint - Uptime.
- Leave the rest default and Save.
Lastly, add the datapoint to your station:
- Navigate to Administration → Stations → Edit your device → Stationdatapoints.
- Press Add Datapoint.
- New section should appear, find your Uptime datapoint in the list.
- Press Add datapoint.
Results
If everything was configured correctly, you should now see the device Uptime in the datapoint list.
Troubleshooting
If you are unable to retrieve data from your device, make sure you have configured everything properly:
- Make sure your device has WAN access.
- Check if the MODBUS configuration is correct in device's WebUI.
- Recheck the portal configuration steps.
Additional sources
You can find MODBUS addresses used on Teltonika devices here:


