RMS Device Details
From Teltonika Networks Wiki
Summary
Here you can see all the details and metrics of the device, various logs and other features that were configured on RMS regarding the selected device will also be shown here.
You can get here by clicking on ![]() icon in the device list in the Actions column.
icon in the device list in the Actions column.
![]()
Overview
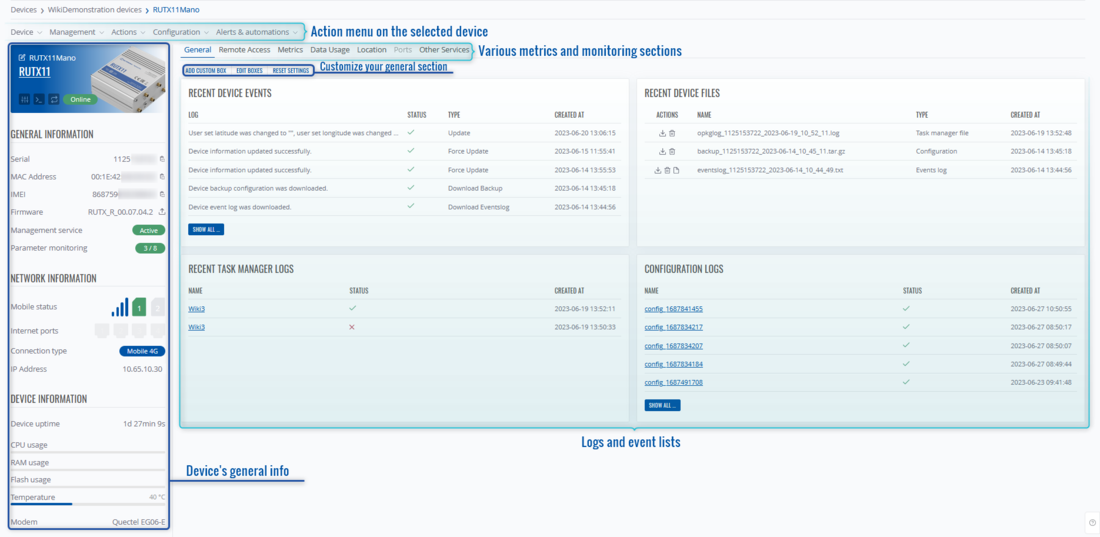
Here you see the UI of Device details:
- In the left upper corner you can see an action menu on this specific device, it's the same menu as on the Devices page when any device is selected.
- In the right upper corner you can update/refresh details on this device, view details on a specific date or view history on any selected parameter, and view the device introduction.
- In the middle you will see general information about the device and its status.
- In the lower area you will see other information depending on the selected tab.
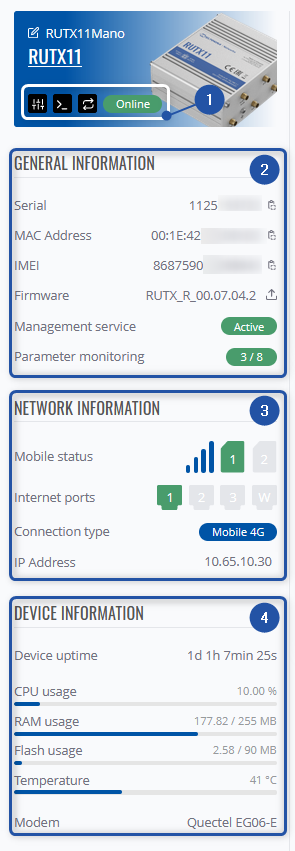
- Information about the selected product, and its connection status. You can also change its name, and description, or connect to its WebUI, CLI.
- Current system usage, serial number, current firmware version, temperature.
- Ethernet ports status - their current usage, speed, duplex type.
- Mobile status - current SIM status, signal strength, operator, and data usage.
- Periodic backups - their frequency, enabled/disabled status, and periodic backup files.
General
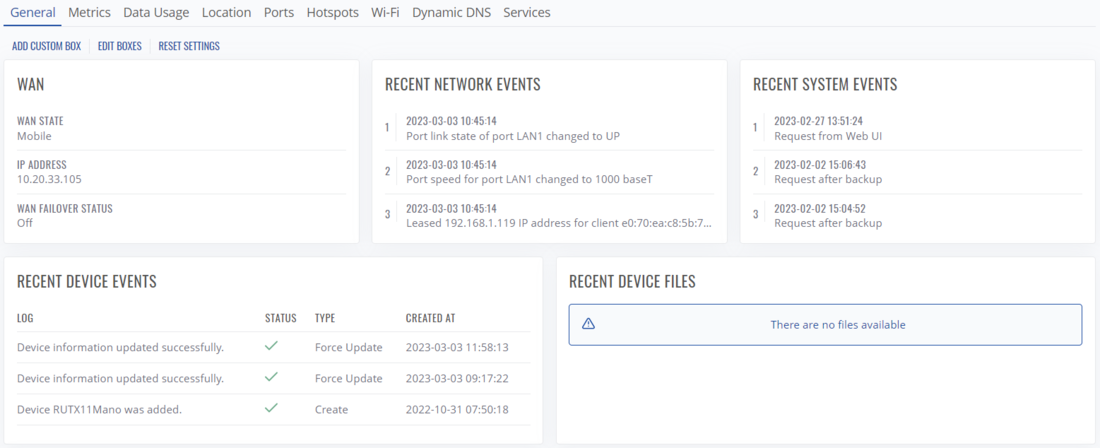
In this tab you check other general information about this device:
- WAN status
- Most recent network, system or device events,
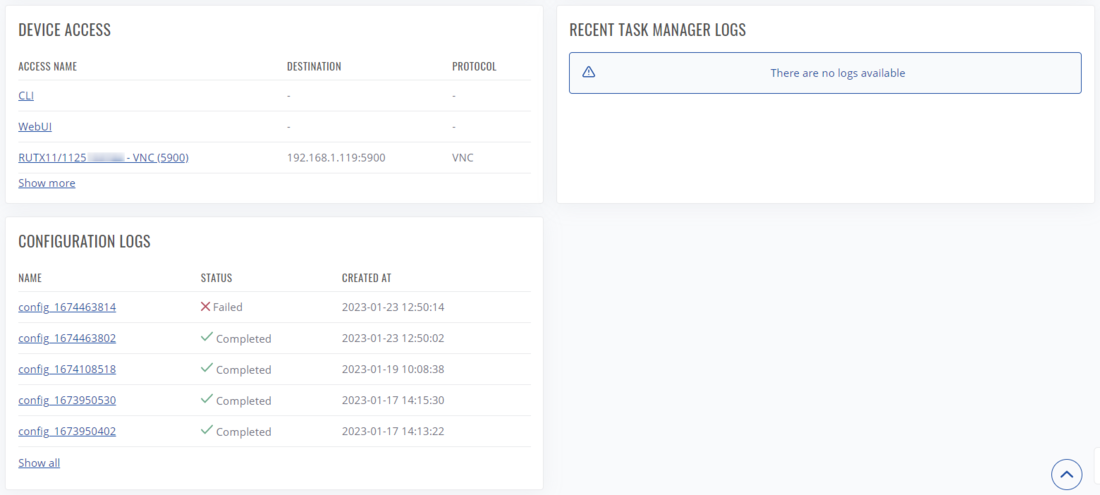
- Most recent device files or logs
- Configured Device Access connection list.
Additionally, you can customize this tab to your own preferences.
By using this menu, you can:


