Monitoring with ThingsBoard IoT Platform
The information on this page is updated in accordance with the 00.07.14 firmware version .
Introduction
This article contains instructions on how to configure ThingsBoard IoT platform and connect Teltonika-Networks devices. ThingsBoard IoT platform is an open-source IoT platform for data collection, processing, visualization, and device management. It enables device connectivity via industry standard IoT protocols - MQTT, CoAP and HTTP and supports both cloud and on-premises deployments. ThingsBoard combines scalability, fault-tolerance and performance so you will never lose your data.
Configuring ThingsBoard IoT platform
The goal of this tutorial is to demonstrate the basic usage of the most popular ThingsBoard features which helps monitor Teltonika-Networks devices.
First, you need to login into the platform. Next, you will see an overview window, scroll down to Entities section and simply click on the Device in the navigation menu.
- Click on one of the marked in red buttons in the overview page Entities → Devices. In this page you can also add additional device in order to distinguish different devices with unique data flows.
- Click marked "+" buttons to add new device to the group.
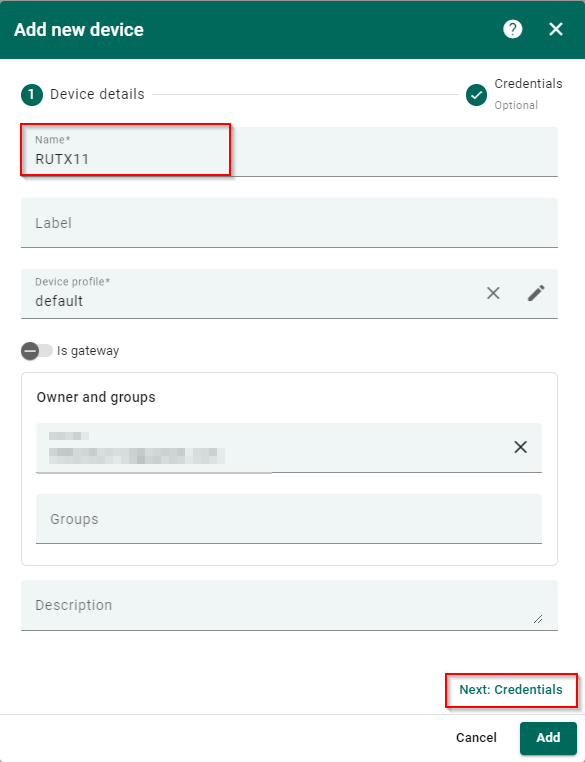
- In the pop up window set name for your device.
- Configure your device's Label (Optional)
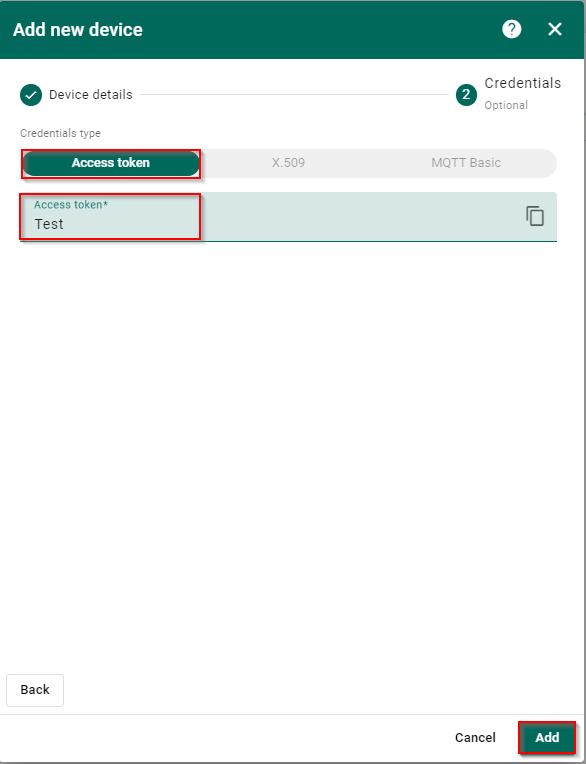
Credentials type: Access token (HTTP protocol)
- Enable Add credentials option.
- Set desirable Access token.
- Click Add button to save changes.
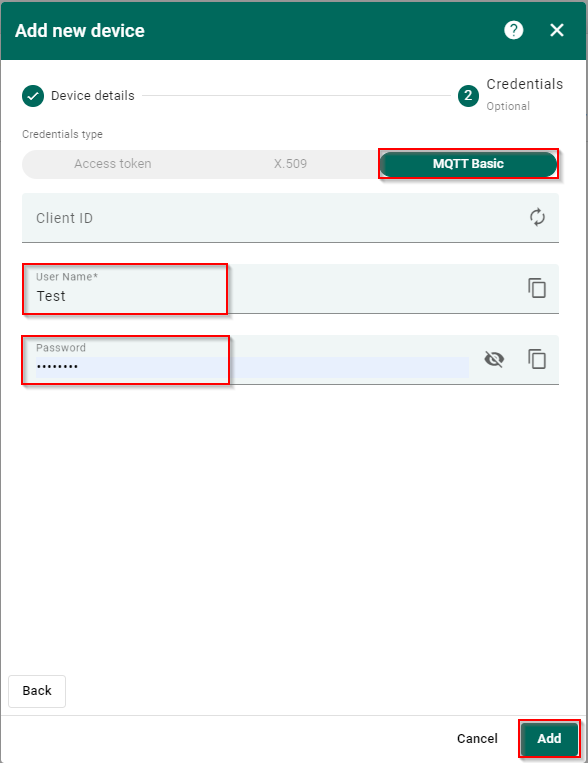
Credentials type: MQTT Basic
- Enable Add credentials option.
- Choose Credentials type:MQTT Basic.
- Set username which will be used in MQTT authorization.
- Set password which will be used in MQTT authorization.
- Click Add button to save changes.
Preparing data source
Different data streams can be selected depending on the device's supported functionality's. In this example we will be using Modbus TCP Server with native Modbus TCP Client functionality.
1. First, change WEBUI mode from basic to advanced.

2. Go to Services → Modbus → Modbus TCP Server page.
3. Enable Modbus TCP Server.

4. Go to Services → Modbus → Modbus TCP Client page and add new Server device.

5. Configure Modbus TCP master's Server device:
- Enable the instance;
- Choose your desired Name for the instance;
- Choose your device's address, in this case, we are using routers address - 192.168.11.1;
- Choose the period on how often the data should be sent, in this case we use 10;
6. Add a new instance of request and configure it by your needs. In this example, we will get the devices uptime:
- Click on Add button;
- Choose the Data type - 32bit UINT, Byte order 1,2,3,4;
- Choose the Function - Read holding register (3);
- Write the First register number - 2;
- Write the Register count / Values - 2;
- Enable the request;
- Click on Test button, to see if the request is configured correctly as shown below;
Configuring data to server with HTTP protocol
After configuring the data source, you can add a data sender configuration. Data sender functionality is located Services → Data to server. You can add data sender by clicking Add button.
- Configure Data:
- Choose your desired Name for the instance;
- Choose Type - Modbus;
- Choose Format Type - Custom;
- Choose the data that you want to send;
- Once done configuring, click on Next: collection edit button;
- In Collection configuration, we can leave default settings, so we can move onto Server configuration:
- Configure Server instance:
- Type - HTTP;
- Server address - https://thingsboard.cloud/api/v1/<your_access_token_here>/telemetry;
- HTTP headers - Content-Type:application/json
Configuring data to server with MQTT protocol
After configuring the data source, you can add a data sender configuration. Data sender functionality is located Services → Data to server. You can add data sender by clicking Add button.
- Configure Data:
- Choose your desired Name for the instance;
- Choose Type - Modbus;
- Choose Format Type - Custom;
- Choose the data that you want to send;
- Once done configuring, click on Next: collection edit button;
- In Collection configuration, we can leave default settings, so we can move onto Server configuration:
- Configure Server instance:
- Type - MQTT;
- Server address - thingsboard.cloud;
- Topic - /v1/devices/me/telemetry;
- Client ID - Generated ID from ThingsBoard;
- Username - Created Username from ThingsBoard;
- Password - Created Password from ThingsBoard;
Adding widget to the dashboard
The collected data can be displayed using various a widgets. To create one you should be able to see gathered data in the Latest telemetry section. To access it you should follow these steps:
- Click on the configured device.
- From the pop-up menu select Latest telemetry option. There you should see collected data.
In order to display data in the widget you should:
- Click on the gathered data row.
- Press Show on widget button.
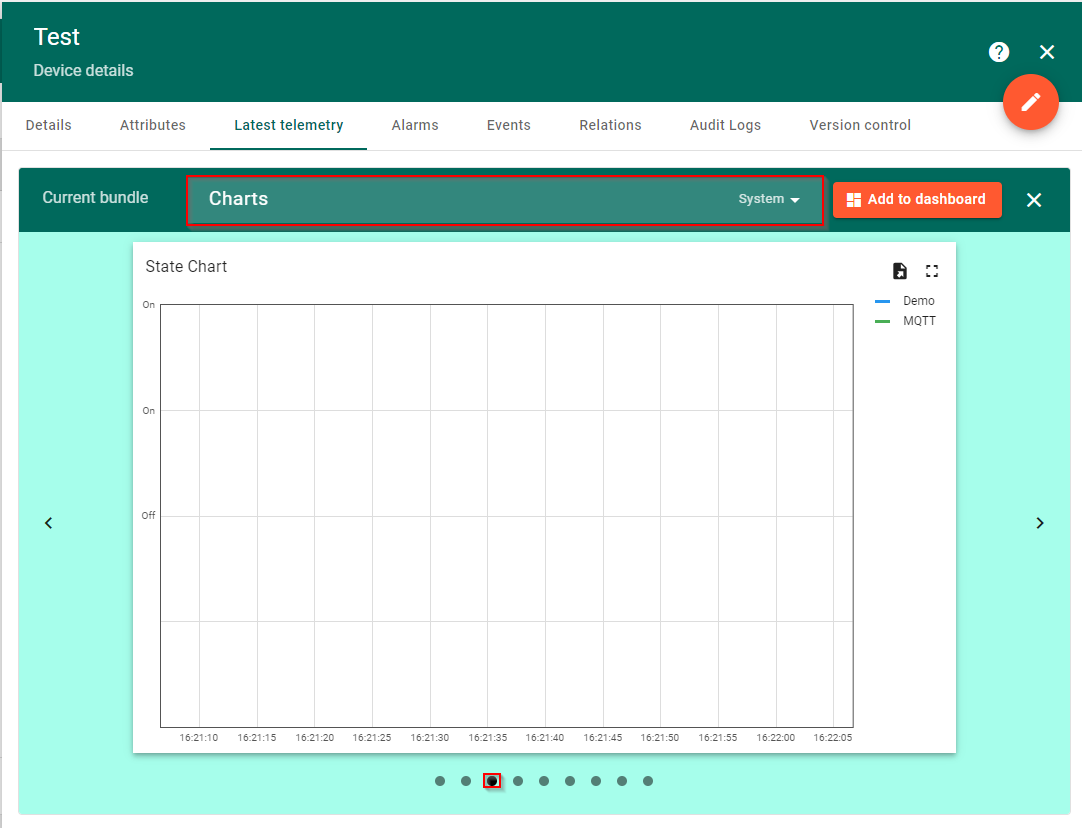
- Choose bundle accordingly to your data.
- Choose suitable chart for your data visualization.
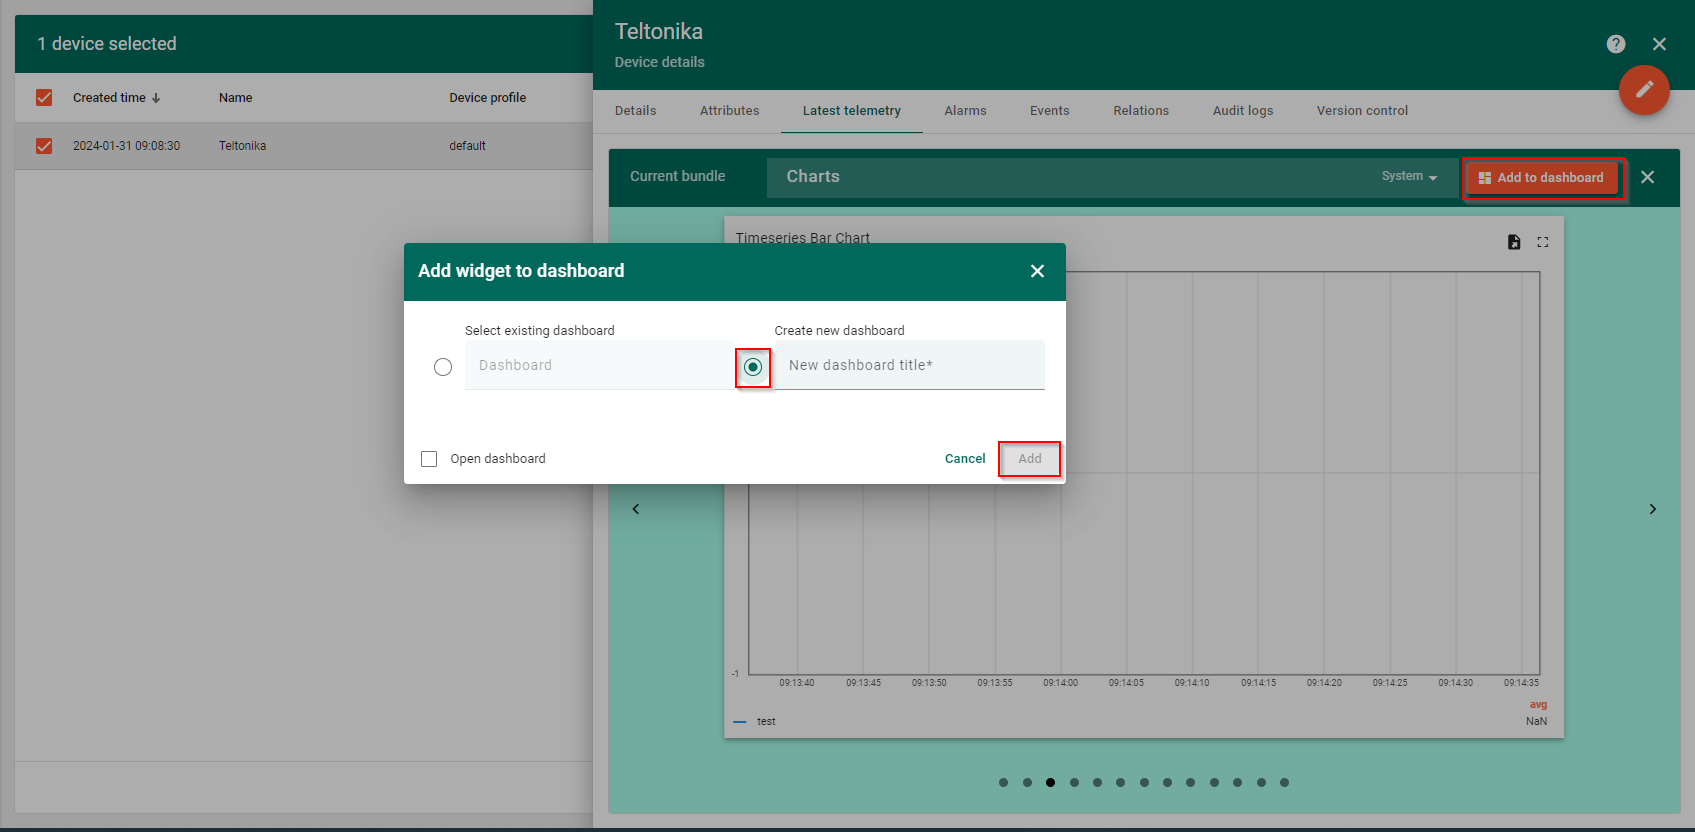
- Add widget to dashboard.
- Create new dashboard.
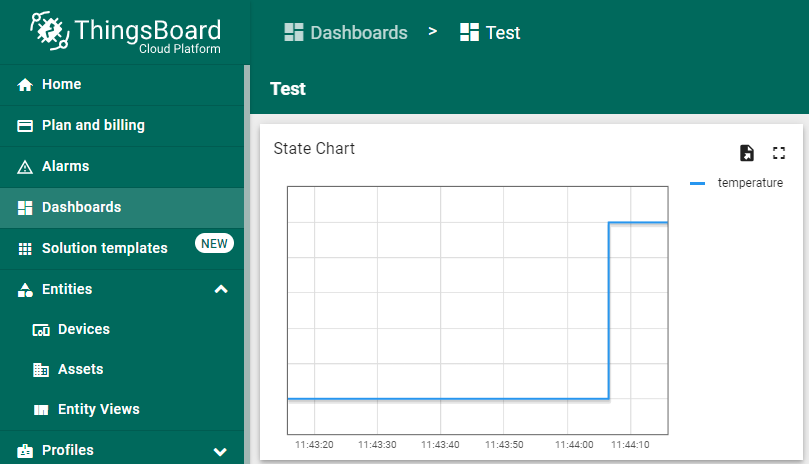
- With this option enabled after addition you will be redirected to newly created dashboard
- Adds widget to dashboard.


