Difference between revisions of "RUT850 Graphs"
From Teltonika Networks Wiki
(Created page with "==Summary== The real-time '''Graphs''' page displays various statistical data changes over time in the form of graphs. ==Mobile Signal Strength== The '''Mobile Signal Stren...") |
|||
| Line 1: | Line 1: | ||
==Summary== | ==Summary== | ||
| − | + | {{Template: webui_status_graphs_summary}} | |
| − | ==Mobile Signal | + | ==Mobile Signal== |
| − | + | {{Template: webui_status_graphs_mobile_signal_strength_graph}} | |
| + | [[File:Rutxxx webui status graphs mobile signal mobile signal strength v1.png]] | ||
| − | + | ==Load== | |
| − | + | {{Template: webui_status_graphs_realtime_load_graph}} | |
| − | + | [[File:Rutxxx webui status graphs load realtime load v1.png]] | |
| − | |||
| − | |||
| − | [[ | ||
==Traffic== | ==Traffic== | ||
| − | + | {{Template: webui_status_graphs_realtime_traffic_graph}} | |
| − | [[ | + | [[File:Rutxxx webui status graphs traffic realtime traffic v1.png]] |
| − | { | + | {{Template: webui_status_graphs_realtime_traffic_graph_table}} |
| − | |||
| − | |||
| − | |||
| − | |||
| − | |||
| − | |||
| − | |||
| − | |||
| − | |||
| − | |||
| − | |||
==Wireless== | ==Wireless== | ||
| − | + | {{Template: webui_status_graphs_realtime_wireless_graph}} | |
| − | |||
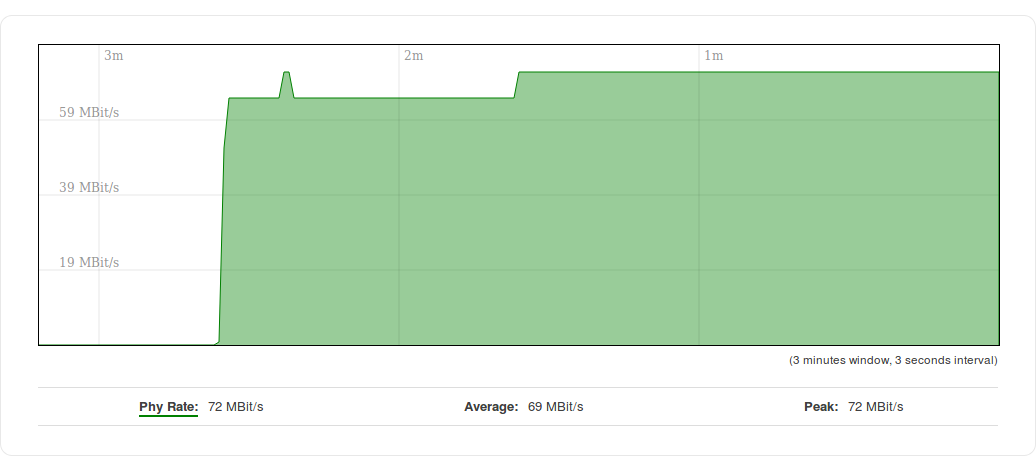
| − | [[ | + | [[File:Rutxxx webui status graphs wireless realtime wireless signal v1.png]] |
| + | [[File:Rutxxx webui status graphs wireless realtime wireless phy rate v1.png]] | ||
| − | == | + | ==Connections== |
| − | + | {{Template: webui_status_graphs_connections_realtime_connections_graph}} | |
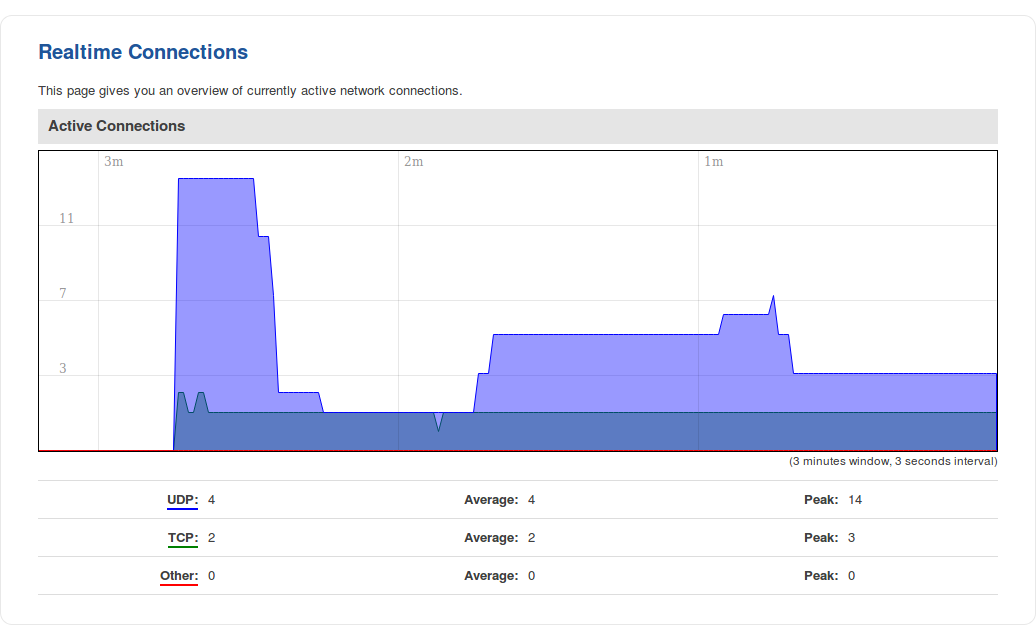
| + | [[File:Rutxxx webui status graphs connections realtime connections graph v1.png]] | ||
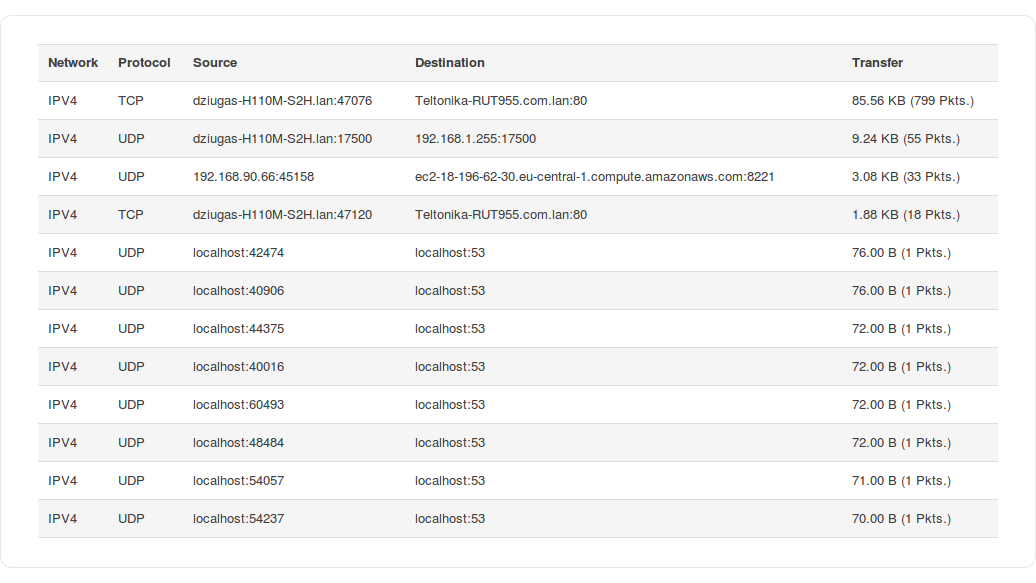
| − | [[ | + | [[File:Rutxxx webui status graphs connections realtime connections list v1.png]] |
Revision as of 13:02, 24 October 2018
Main Page > RUT Routers > RUT850 > RUT850 Manual > RUT850 WebUI > RUT850 Status section > RUT850 GraphsSummary
Template:Webui status graphs summary
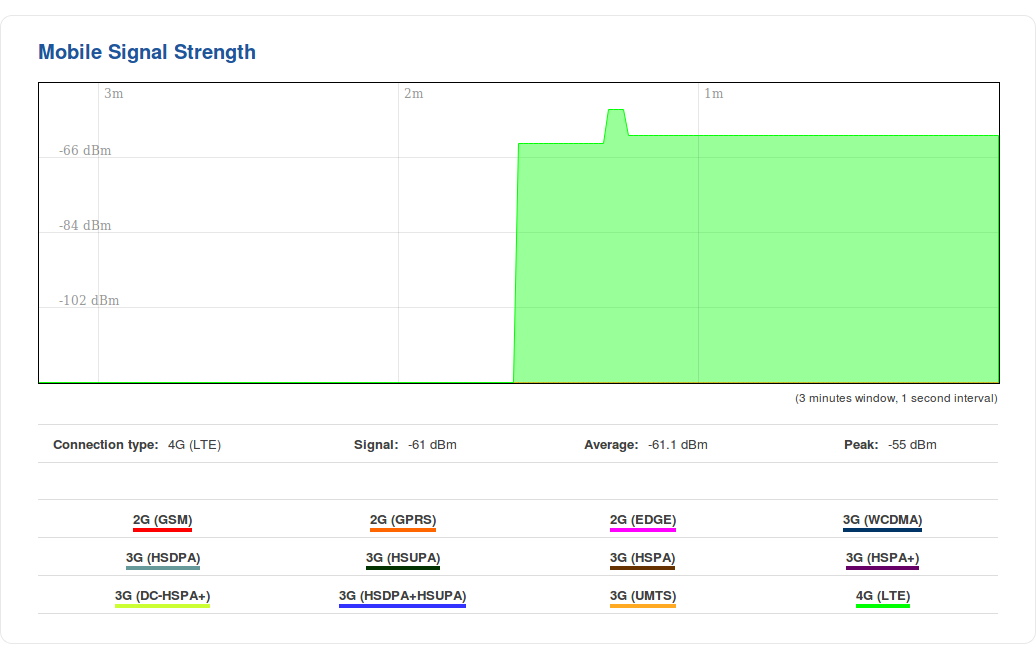
Mobile Signal
Template:Webui status graphs mobile signal strength graph
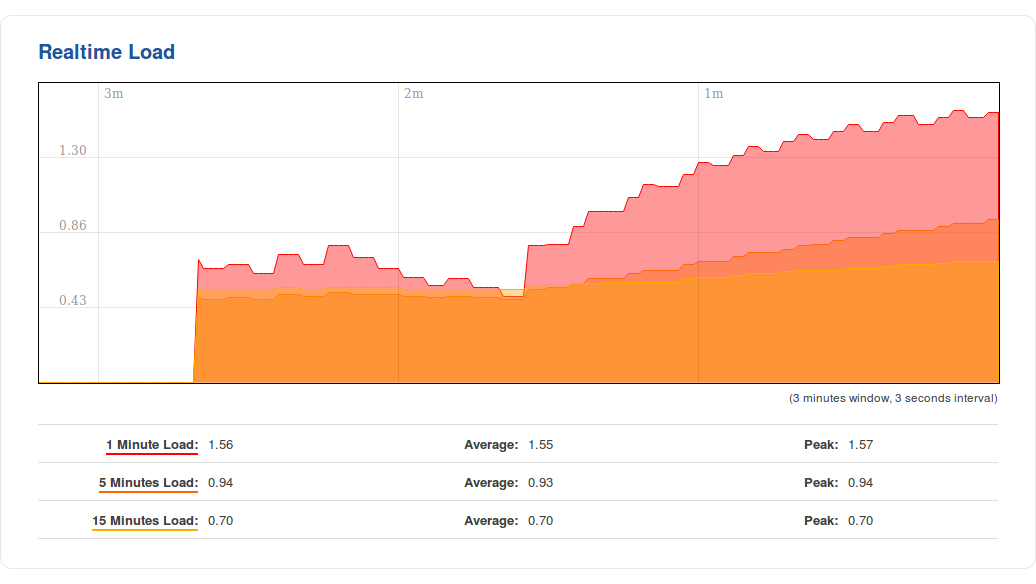
Load
Template:Webui status graphs realtime load graph
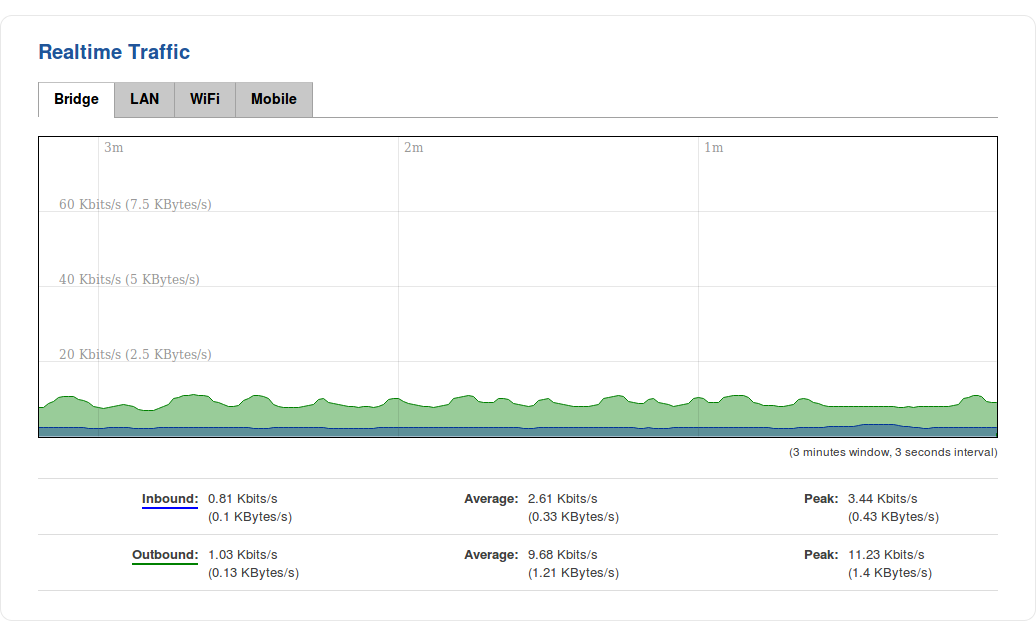
Traffic
Template:Webui status graphs realtime traffic graph
Template:Webui status graphs realtime traffic graph table
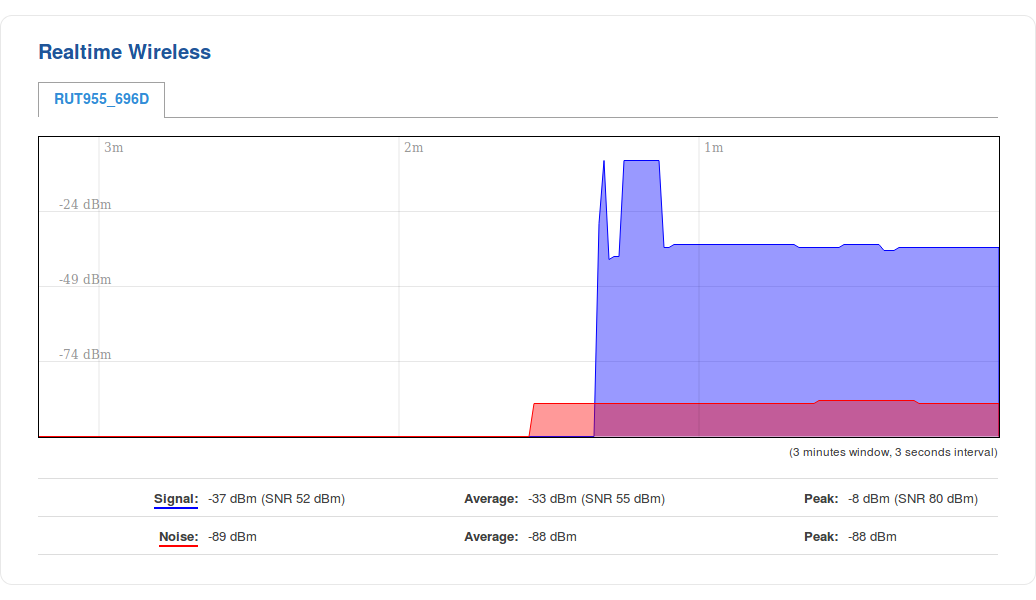
Wireless
Template:Webui status graphs realtime wireless graph
Connections
Template:Webui status graphs connections realtime connections graph
